The percentage of people active in the labor force has dropped substantially over the past 15 years. Part of this decline appears to be the result of secular factors like the aging of the workforce. However, the participation rate among people in their prime working years—ages 25 to 54—has also fallen. Recent research suggests this decline among prime-age workers can be attributed in large part to lower participation from among the higher-income half of U.S. households.
For most people, active participation in the labor market is socially desirable for several reasons. One major benefit is the set of skills and abilities a person gains on the job. Long periods out of employment can mean a worker loses valuable skills. In terms of the overall labor force, this loss is compounded, lowering the accumulation of human capital and negatively affecting economic growth in the long run. As such, a decline in labor force participation, particularly among workers in their prime, is a significant concern for policymakers.
Over the past 15 years, the labor force participation (LFP) rate in the United States has fallen significantly. Various factors have contributed to this decline, including the aging of the population (Daly et al., 2013) and changes in welfare programs (Burkhauser and Daly, 2013). In this Economic Letter, we look at another potential contribution, the changing relationship between household income and the decision to participate in the labor force.
Measuring labor force participation
People are considered “in the labor force” if they are employed or have actively looked for work in the past four weeks, according to the Bureau of Labor Statistics definition of unemployment. Following this definition, we study labor market participation and how it relates to household income using data from the Survey of Income and Program Participation (SIPP). Administered by the Census Bureau since 1983, the SIPP was created to remedy shortcomings in existing survey data on household incomes and benefit-program participation, such as the March Income Supplement to the Current Population Survey. The SIPP collects detailed information on a person’s labor force activities, a wide range of demographic data, the receipt of cash and in-kind income, and participation in government programs.
Comparisons of LFP rates over time need to control for the ever-changing demographic characteristics of the U.S. population, such as age, educational attainment, and race and ethnicity. For example, aggregate participation may decline if a certain group—say, individuals over age 55, who are less likely to be working—gain greater prominence in the overall population. In this case, we would observe a decline in overall participation even if there had been no change in each individual’s propensity to be in the labor market.
We use a probability model to determine the likelihood that an individual with a specific set of demographic characteristics will participate in the labor market. Crucially, this allows us to compare the behavior of similar individuals at different points in time. The factors we include are age and sex, household structure (at least two individuals in the household over age 25), education (less than high school, high school, college, or post-graduate), and race and ethnicity (white, black, Hispanic/Latino, Asian, or other). All LFP rates we report in this Letter control for these demographic characteristics.
The LFP rate for people between the ages of 25 and 54 was 83.8% in 2004, then dropped to 81.2% by 2013. This 2.6 percentage point decline has persisted well beyond the end of the Great Recession and has caught the attention of policymakers, particularly because it concerns workers in their prime who are usually active participants in the labor market.
Measuring household income
Each individual in the SIPP is associated with a household, and the survey provides a detailed account of the household’s monthly income. Households are then ranked according to income level, and divided evenly into four quartiles across the range of the household income distribution. In 2013, households in the lowest 25% of the income distribution, or the first quartile, had an average monthly income of less than $1,770. The median total household monthly income was $3,430. At the top of the distribution, the lower bound for being in the highest 25% of households, or the fourth quartile, was a monthly income of $5,993.
Earnings from work are typically the main source of income for a household regardless of its position within the household income distribution. Other sources are property income and various support programs such as social security, veteran benefits, and public assistance. On average in 2013, the upper-level households derived about 96% of their monthly income from working. For households in the poorest quartile, earnings made up about 62% of monthly income, while another 23% came from unemployment compensation, social security, supplemental social security, and food stamps.
Labor force participation and household income
We sort prime-age individuals according to their household’s position in the income distribution. The probability of participating in the labor market for those in the poorest households in 2013 was just 61.5%, compared with 81.2% for all 25- to 54-year-olds (see Table 1). Further up the household income distribution, individuals are more likely to actively participate in the labor market—in the top quartile, the participation rate was 89.9% in 2013.
Table 1
Labor force participation among prime-age workers across household income distributions
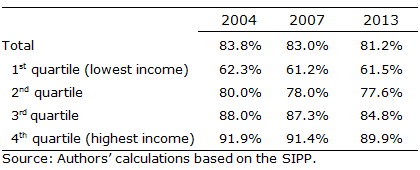
Looking back in time, we see that the decline in the LFP rate of prime-age workers is unevenly spread across the income distribution. The poorest quartile had the smallest change since 2004, falling 0.8 percentage point. The second quartile fell 2.4 points, while the third quartile reported the largest drop with 3.2 points. Participation also fell 2.0 percentage points for households in the fourth quartile.
Figure 1 shows how much each household income quartile contributed to the 2.6 percentage point overall decline in LFP among workers ages 25 to 54 since 2004. Each quartile’s contribution is the sum of two numbers. The first is the change in the probability that an individual living in a particular household income bracket will participate in the labor market. The second is the change in household size over time, which raises or lowers the number of people in a household income grouping. For instance, the poorest quartile saw a small decline in individual participation rates. At the same time there was a modest increase in the average number of people living in these households. Taken together, the poorest quartile added 0.7 percentage point to the total participation rate between 2004 and 2013 (red line). Likewise, the second quartile (yellow line) added 0.4 percentage point.
Figure 1
Changes in labor participation among prime-age workers
Total and contribution by quartiles of household income distribution
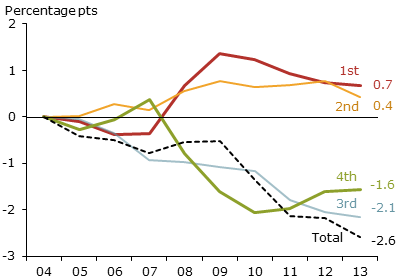
Note: Numbers to right of lines show percentage point changes to
total and quartile contributions, 2004–13.
By contrast, individuals in the two highest income quartiles have increasingly remained out of the labor force during this time frame. Individuals in the fourth quartile (green line) accounted for 1.6 of the 2.6 percentage point decline in total participation since 2004, while those in the third quartile (blue line) contributed the most to the decline, a full 2.1 percentage points. By this measure, virtually all of the decline in labor market participation among 25- to 54-year-olds can be attributed to the higher-income half of American households.
Participation among younger and older workers
We can also extend this analysis to the remaining age groups: young people under age 25 and older workers age 55 and over. Doing so will allow us to examine the contribution of each group to the decline in the LFP of the working-age population, that is, all individuals over age 16. Indeed, the LFP of the working-age population dropped 4.8 percentage points over this period, from 67.2% in 2004 to 62.4% in 2013.
As a first step, Figure 2 depicts the total decline in labor force participation and the contribution from each of the three age groups between 2004 and 2013.
Figure 2
Contribution by age group to changes in labor participation
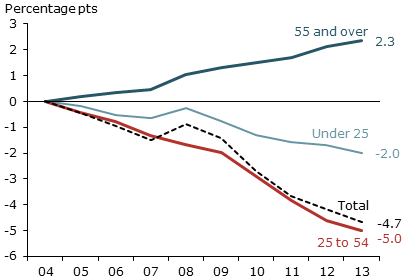
Source: Authors’ calculations based on the SIPP.
The decline among young workers from 61.8% participation in 2004 to 52.2% in 2013 is striking. Although young workers represent only 16% of the overall working-age population, the 9.6 percentage point decline of the young pulled the aggregate rate down by 2.0 percentage points (light blue line). The pattern of young workers’ participation across the household income distribution, shown in panel A of Figure 3, is similar to that of prime-age workers. Young workers in the highest-income households contributed the largest drop, 3.8 percentage points, while those in the lowest-income households contributed only 0.8 percentage point to the decline for their age group.
Figure 3
Change in labor force participation by household income quartile
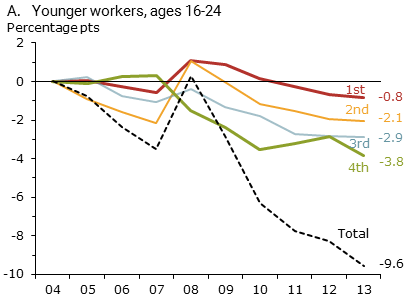
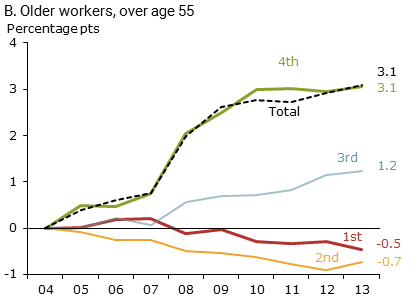
Note: Numbers to right of lines show percentage point changes to total and quartile contributions, 2004–13.
The LFP rate of those over age 55 differs from what we have seen for the other age groups in two respects. First, their likelihood of being in the labor market has increased 3.1 percentage points; together with their increased share of the population, these conditions pushed the aggregate LFP rate up 2.3 percentage points, as shown by the dark blue line in Figure 2. Second, we do not find the same household income pattern among older workers as we found for the other age groups. Rather, panel B of Figure 3 shows that individuals in the highest-income households provided the bulk of the increase in labor force participation.
Conclusion
To get a clearer view of the factors underlying the decline in labor force participation, this Letter has examined how work trends have changed across different age groups and income levels. Our findings suggest that the decline in participation among people of prime working age has been concentrated in higher-income households. A similar pattern appears among younger workers, between the ages of 16 and 24. However, this has not been the case among older workers. Workers over the age of 55, particularly those in households at the top of the income distribution, have been increasingly participating in the labor force. Further research should help understand the underlying reasons for these diverging trends across household incomes.
Robert Hall is Robert and Carole McNeil Joint Hoover Senior Fellow and Professor of Economics at Stanford University.
Nicolas Petrosky-Nadeau is a research advisor in the Economic Research Department of the Federal Reserve Bank of San Francisco.
References
Burkhauser, Richard, and Mary C. Daly. 2013. “The Changing Role of Disabled Children Benefits.” FRBSF Economic Letter 2013-25 (September 3).
Daly, Mary C., Early Elias, Bart Hobijn, and Òscar Jordà. 2012. “Will the Jobless Rate Drop Take a Break?” FRBSF Economic Letter 2012-37 (December 17).
Opinions expressed in FRBSF Economic Letter do not necessarily reflect the views of the management of the Federal Reserve Bank of San Francisco or of the Board of Governors of the Federal Reserve System. This publication is edited by Anita Todd and Karen Barnes. Permission to reprint portions of articles or whole articles must be obtained in writing. Please send editorial comments and requests for reprint permission to research.library@sf.frb.org