Is the current recovery more likely to end because it’s lasted so long? Have various imbalances and rigidities accumulated to make the economy frailer and more susceptible to a recessionary shock? Recent history suggests the answer is no. Instead, a long recovery appears no more likely to end than a short one. Like Peter Pan, recoveries appear to never grow old.
Recent economic indicators show that U.S. economic growth has slowed considerably. After adjusting for inflation, aggregate output increased little during the final three months of 2015. Is this the start of a serious stumble by an aging economy with creaky knees? Are we due for a recession? Or is the slowdown just part of the normal ups and downs of a healthy, dynamic economy?
Recessions are notoriously difficult to forecast. However, much conventional wisdom views an aging expansion as increasingly fragile and more likely to end in recession. The associated predictions of recession—proclaiming that “it’s about time” for a downturn—have become more prominent lately because the current recovery, which started six and a half years ago, is relatively long already. For example, Rebecca Jarvis from ABC News asked Federal Reserve Chair Janet Yellen about this issue at the most recent Federal Open Market Committee press conference (Board of Governors 2015):
Rebecca Jarvis: Historically, most economic expansions fade after this long. How confident are you that our economy won’t slip back into recession in the near term?
Chair Yellen:…I think it’s a myth that expansions die of old age. I do not think that they die of old age. So the fact that this has been quite a long expansion doesn’t lead me to believe that…its days are numbered.
The notion that business expansions are more likely to end as they grow older was especially common before World War II. Gottfried Haberler’s (1937) classic synthesis of prewar business cycle theories devotes an entire section to the topic: “Why the Economic System Becomes Less and Less Capable of Withstanding Deflationary Shocks After an Expansion Has Progressed Beyond a Certain Point.” Nowadays, the underlying rationale for this view follows an analogy to human mortality: As the expansion ages, assorted imbalances and rigidities accumulate that hobble the economy and make it more fragile. Thus, the recovery could be jeopardized by ever smaller shocks, and it becomes more likely over time that the economy will fall into recession.
However, the historical record since World War II does not support the view that the probability of recession increases with the length of the recovery. The earliest statistical investigation of the issue by Diebold and Rudebusch (1990) found that postwar expansions were not more likely to end as they endured. This Economic Letter updates that analysis. The results concur with Yellen’s view that, all else equal, longer expansions are no more likely to end than shorter ones.
Calculating the probability of dying of old age
Survival analysis—also known as duration or reliability analysis—is a branch of statistics that examines the probabilities of events, such as the death of a biological organism, the failure of a machine, or the acquisition of a job. The analysis focuses on how such probabilities change over time. For example, survival analysis implicitly plays an important role in the used car market. All else equal, as a car ages, the probability that it will suffer a mechanical breakdown increases. Thus, older cars are considered less reliable and generally command a lower price in the marketplace. Understanding the relationship between the age of a vehicle and the likelihood of its breakdown is a simple application of survival analysis.
Survival analysis is also widely applied to human mortality rates in life insurance calculations. A key insight from this type of analysis is that the probability of death at any point in time can be inferred from the distribution of the actual lifetimes recorded for a population. Therefore, a demographer can calculate mortality rates at various ages by examining the age distribution of those who died.
Like other pension administrators, the Social Security Administration uses these statistical methods. Their estimates of mortality rates for U.S. males are shown in Figure 1. These rates give the probability that a man of a certain age will die during the subsequent year. For example, a 50-year-old man has a ½% chance of dying during the next year, while a 90-year-old has a 17% chance. Put another way, a 50-year-old man has a 99.5% chance of surviving another year, while a 90-year-old has only an 83% chance.
Figure 1
Probability of a person dying within a year:
Males, based on 2011 actuarial tables
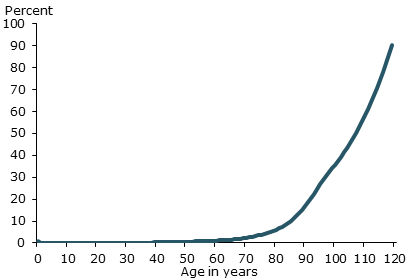
How mortality rates vary with age is of particular interest. From childhood to around age 65, there is only a very modest increase in mortality rates. Over that range, the likelihood of dying is little affected by age, so the probability of death effectively exhibits no age or duration dependence. However, after age 65, the likelihood of dying rises markedly with age. That is, above the age of 65, the probability of death shows increasing age dependence, also known as positive duration dependence. Indeed, after age 107, death in the following year becomes more likely than survival. Of course, as in other contexts, these mortality rate curves are not set in stone. Advances in medicine and public health have allowed people to live longer and caused the curve in Figure 1 to steadily shift to the right for more than a century.
Do economic recoveries die of old age?
The techniques of survival analysis are well-suited to investigating the probability that a business expansion will end, as described by Diebold and Rudebusch (1990) and Sichel (1991). In this application, the event being predicted is a business cycle peak, which marks the end of a recovery and the start of the subsequent recession. In particular, it will be possible to calculate whether this probability increases with the age of the expansion.
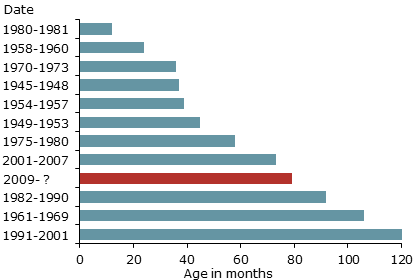
The raw data for this calculation are the lengths of past business expansions—similar to the human lifetimes used earlier. The durations of expansions in the United States since World War II are shown in Figure 2. They are determined by the National Bureau of Economic Research (NBER), which dates the beginning and end of each expansion. According to the NBER, the last recession in the United States—the Great Recession—ended in June 2009. Since then, the recovery has lasted six and a half years, which is substantially longer than most previous business expansions. This ongoing recovery is shown in red, and its end date is noted as a question mark. Other postwar expansions range from 12 months for the 1980–81 recovery to 10 years for the long boom of the 1990s. Very short expansions—say, only eight months long—are never observed because the NBER requires an upturn in business activity to surpass a minimum duration of almost a year before it can be formally designated as an expansion.
Figure 2
Durations of postwar expansions
As in the human mortality study, the statistical techniques of survival analysis can be used to translate these durations into expansion mortality rates, that is, conditional probabilities that an expansion will end in the subsequent month given that it has lasted so long already. The dark blue line in Figure 3 shows the estimated mortality rates for postwar expansions, calculated assuming the widely used Weibull probability distribution. For example, Figure 3 shows that a 50-month-old expansion has a 2% chance of ending in the next month or, if this probability is cumulated over the next 12 months, the expansion has about a 23% chance of ending during the next year. These calculations take into account the fact that very short expansions are truncated in the data and that the current recovery is ongoing.
Figure 3
Probability of a recovery ending within a month
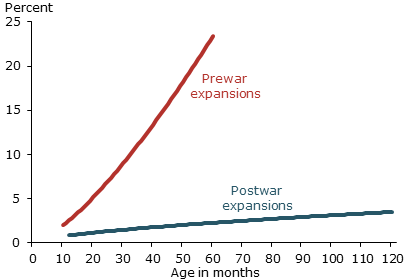
It is notable that the line for postwar expansions in Figure 3 is nearly flat—like the early human mortality rates in Figure 1. This means that the mortality rates for postwar expansions don’t really depend on the length of the expansion. Indeed, a statistical test cannot reject the hypothesis that the dark line really is flat and that the probability of a recession in any month is independent of the age of the recovery. Accordingly, based only on age, an 80-month-old expansion has effectively the same chance of ending as a 40-month-old expansion. Therefore, the current recovery is no more likely to end simply because it’s approaching its seventh birthday.
In contrast, the same statistical technique yields very different results when applied to prewar expansions from 1854 to 1938. As shown by the red line in Figure 3, mortality rates for expansions before World War II increased with the length of the expansion. This positive duration dependence means that prewar expansions were more likely to end as they grew older. The evidence that duration dependence disappeared from the prewar to postwar periods has been supported by further work in Diebold and Rudebusch (1999) and the more recent studies listed in Castro (2013).
Several postwar changes in the economy contributed to more robust and longer-lived expansions. One such change is the increased share of services instead of tangible goods in the economy’s output; this would tend to diminish the importance of inventory fluctuations and moderate the business cycle. Even more importantly, the postwar shift to less fragile recoveries reflects the new influence of a large federal government actively focused on stabilizing the economy. For example, a new postwar full-employment mandate, the Employment Act of 1946, applied broadly to the federal government, including to the Federal Reserve and in the conduct of monetary policy (Judd and Rudebusch 1999). The postwar change in macroeconomic management away from a laissez-faire hands-off attitude toward a forceful countercyclical policy helped prolong business expansions and alter the pattern of business cycle age dependence. Furthermore, the federal commitment to macroeconomic stabilization also included attempts to curtail recessions. This is consistent with additional evidence in Diebold and Rudebusch (1990) that postwar economic recessions show more duration dependence than prewar ones. In other words, as postwar recessions age, they become more likely to end as policymakers take action to revive growth.
Conclusion
Empirical evidence indicates that expansions during the past 70 years do not become progressively more fragile with age. This evidence supports the view of Fed Chair Yellen that the current recovery is not living on borrowed time. Expansions, like Peter Pan, endure but never seem to grow old.
Glenn D. Rudebusch is director of research and executive vice president in the Economic Research Department of the Federal Reserve Bank of San Francisco.
References
Board of Governors of the Federal Reserve System. 2015. “Transcript of Chair Yellen’s Press Conference, December 16, 2015.” Washington, DC.
Castro, Vitor. 2013. “The Duration of Business Cycle Expansions and Contractions: Are There Change-Points in Duration Dependence?” Journal of Empirical Economics 44, pp. 511–544.
Diebold, Francis X., and Glenn D. Rudebusch. 1990. “A Nonparametric Investigation of Duration Dependence in the American Business Cycle.” Journal of Political Economy 98 (June), pp. 596–616.
Diebold, Francis X., and Glenn D. Rudebusch. 1999. Business Cycles: Durations, Dynamics, and Forecasting. Princeton: Princeton University Press.
Haberler, Gottfried. 1937. Prosperity and Depression: A Theoretical Analysis of Cyclical Movements. Geneva: League of Nations.
Judd, John, and Glenn D. Rudebusch. 1999. “The Goals of U.S. Monetary Policy.” FRBSF Economic Letter 1999-04 (January 29).
Sichel, Daniel. 1991. “Business Cycle Duration Dependence: A Parametric Approach.” The Review of Economics and Statistics 73(2), pp. 254–260.
Opinions expressed in FRBSF Economic Letter do not necessarily reflect the views of the management of the Federal Reserve Bank of San Francisco or of the Board of Governors of the Federal Reserve System. This publication is edited by Anita Todd and Karen Barnes. Permission to reprint portions of articles or whole articles must be obtained in writing. Please send editorial comments and requests for reprint permission to research.library@sf.frb.org