The muted housing recovery in recent years can be traced in part to slower household formation among young adults. Analysis suggests that the boom and bust in housing has been a key factor. Recent weakness in household formation relative to population growth among young adults represents a reversal of the unusual strength during the boom years. The net effect has left shares of current young adults heading households at levels similar to those in the mid-1990s before the housing boom.
The recovery in the housing sector has been even slower than for the overall economy. In particular, the pace of housing starts remains subdued by historical standards. This muted recovery can be traced in part to the slow pace of household formation, especially among young adults. In turn, the share of young adults living with parents has grown in recent years. This has raised speculation that a sustained pickup in household formation may depend in part on a reversal of that trend.
This Letter looks at the evolving trends for household formation among young adults. The analysis suggests that the recent weakness in household formation relative to population growth among young adults represents a reversal of the unusual strength evident during the housing boom in the late 1990s and early 2000s. In addition, the swing in the shares of young adults identified as heads of household appears to have been driven by the group accelerating their purchases of homes during the housing boom and pulling back from homeownership in recent years. The net effect is that shares of young adults currently heading households appear to have returned to levels similar to those before the boom. This is the case even though more young adults are living with parents. Also notable is that, while factors still weigh on residential choices for young adults, the effects appear mainly to merely delay the timing of household formation.
Household formation in recent years
The pace of household formation slowed substantially in the Great Recession and subsequent recovery. This is evident in Figure 1, which plots annual growth rates for the adult population and household formation. Notably, household growth fell relative to adult population growth after 2007, with an average yearly difference of –0.5 percentage point from 2007 to 2015. In contrast, for nearly five decades earlier, the pace of household formation exceeded population growth about 0.2 percentage point per year on average.
Figure 1
Annual changes in population growth and household formation
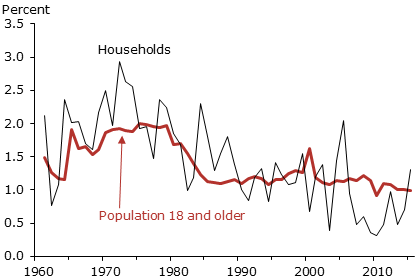
Source: U.S. Census Bureau, Housing Vacancy Survey and Annual Population Estimates; annual rates reflect July year-over-year percent changes.
The notable shift in the relative growth rates after 2007 reflects declines in “headship” rates, that is, the share of the population identified as heads of households. By definition, the percent change in household formation equals the sum of the percent growth in population and the percent change in headship rates. This means that for over five decades headship rates in the United States had increased on average before falling off in the wake of the financial crisis.
Swings in headship rates among young adults
The patterns in headship rates over the housing cycle differ considerably across age groups. Specifically, in recent years most of the changes were among young adults. For two groups—ages 18 to 24 and ages 25 to 29—headship rates have declined appreciably in recent years. Headship rates among older age groups have been more stable.
Also apparent in Figure 2 is that headship rates among young adults rose considerably from the mid-1990s up to the financial crisis. That was the period of the strong housing market, rapidly rising house prices, and booming homeownership rates, including among young adults. Indeed, the movements in shares of young heads of household closely track the rise and decline in homeownership ratios. The link between the swings in household formation and ownership among young adults is illustrated in Figure 3. In the figure, both headship rates (dashed lines) and ownership ratios (solid lines) are relative to the respective age group’s estimated population. For comparison, the figure shows the series for young adults ages 25 to 29 (green lines) and older adults ages 35 to 44 (blue lines). During the upturn in the housing sector, the acceleration in young adults setting up households coincided closely with the acceleration in their home purchases. In contrast, for the older age group, while the homeownership ratio rose then fell back after 2007, headship rates have been relatively stable.
Figure 2
Heads of households as share of age group population
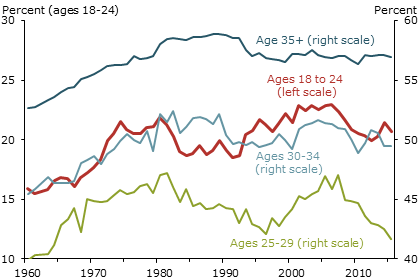
Source: U.S. Census Bureau, CPS Annual Social and Economic Supplement and Annual Population Estimates.
Figure 3
Headship and homeownership as share of age group population
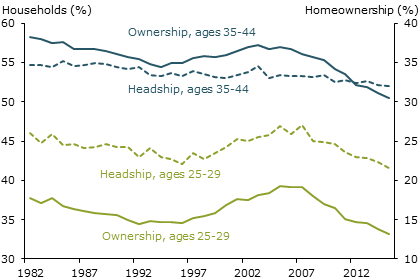
Source: U.S. Census Bureau CPS Annual Social and Economic Supplement, Annual Population Estimates, and Housing Vacancies. Author’s calculations.
The upswings in headship rates appear to have been mostly driven by more young adults purchasing homes during the boom, which some research suggests was assisted in part by easier access to mortgage credit (Adelino 2012). In the housing bust, with tougher credit requirements, deteriorating household balance sheets, and rising foreclosures, ownership ratios plummeted along with headship rates.
Shifts in residential choices
Since rates for heads of households move together with homeownership ratios, it’s interesting to consider how changes in these rates might relate to other residential choices of young adults such as living with others. Indeed, one development highlighted in recent research has been the increase in the share of young adults living with parents over the past several years (Bleemer et al. 2015). That increase can be seen in Figure 4, which plots the shares of young adults living with a parent since the mid-1990s for two groups, ages 18 to 24 and 25 to 29, from the monthly Current Population Survey (CPS).
Figure 4
Young adults living with parents as share of age group
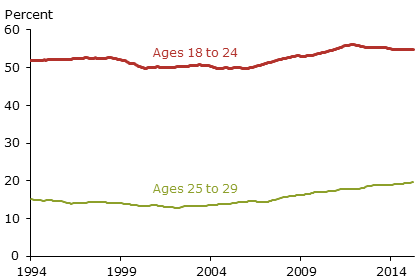
Source: Monthly Current Population Survey.
The shares of young adults living with parents climbed noticeably with the housing bust and onset of the financial crisis. The age 18 to 24 group’s share living with adults has drifted down some from the 2012 peak. On the other hand, the share for those ages 25 to 29 has, at best, shown tentative signs of stabilizing. The Bleemer et al. (2015) research points to a possible influence, the connection between an increase in the shares of young adults living with parents and the rise in student debt.
The increase in shares of young adults living with parents in recent years has clearly coincided with lower headship rates since the housing bust. However, the correspondence between the two is not straightforward. In fact, a longer-term view suggests current rates for young adults heading households are not much different from the mid-1990s near the start of the housing upturn (Figure 2). This in part reflects the fact that shares of young adults living with parents had declined some in the boom before reversing in the wake of the housing bust.
Also, a change in the share of young adults living with parents does not have to be fully offset by changes in the share of young-adult household heads. Other residential options could be offset, such as shares living with other relatives or nonrelatives. Or, if an increase in shares living with parents reflected a decline in marriage rates, with some young adults staying at home longer, the impact on headship rates would depend on relative changes in the shares of unmarried versus married household heads.
The latter case is particularly pertinent to the formation of households by young adults over the longer horizon. CPS data on young adults in selected residential categories show that the share of married young adults living with a relative (including a spouse) has declined substantially since 1994. This is consistent with a marked decline over the period in the shares of young adults that are married. Not surprisingly, this has coincided with an increase in the shares living with parents and a decline in the shares of married heads of households. However, the latter decline has essentially been offset by increases in the shares of young adult heads of households that are not married. As noted earlier, the net effect is that shares of young adults heading households are similar to those in the mid-1990s.
Transitions to higher headship rates
The analysis so far indicates that current vintages of young adults appear to be forming households more or less in line with rates seen before the housing boom. This is the case despite the persistence of factors related on residential choices and, other things equal, associated with lower headship rates among young adults. One notable factor is the sharp increase in the share of young adults not in the labor force. For example, since 2000, the share of 18- to 24-year-olds not in the labor force has increased 8.5 percentage points to a level of 35%. Analysis of the factors associated with different residential choices by this age group shows the share not in the labor force is associated with about a 1 percentage point lower headship rate for the age group, or more than 300,000 fewer households.
It’s perhaps more notable that, whatever factors are weighing on young adult residential choices, the effects appear mainly to merely delay the timing of the decision to set up households. In recent years, while more young adults were living at home longer, as a specific cohort aged, it continued to transition to higher headship rates over time. The headship rate among 25- to 29-year-olds has consistently run below that for 30- to 34-year-olds. However, the gap has tended to close, even in recent years. For example, given the five years needed for full transition, as of March 2011, the 12-month average headship rate based on the monthly CPS data for the group ages 30 to 34 was about 51% compared with about 45% for ages 25 to 29 at the time, a gap of 6 percentage points. Jump ahead five years to March 2016 and the headship rate for the new set of 30- to 34-year-olds is at 51%, fully closing the earlier gap.
Implications for household formation
The key drivers of household formation over time are population growth and the evolution of headship rates. This Letter has noted that the slow pace of household formation in the Great Recession and recovery was due primarily to a decline in headship rates, especially among young adults. To a large degree, that decline has retraced the marked rise in shares of young adults setting up households during the housing boom. There are reasons to believe this apparent realignment is nearing completion. The shares of young adults heading households now are similar to rates seen at the start of the housing boom. Moreover, while more young adults are living at home longer, data suggest they are continuing to transition to higher headship rates as they get older.
To the extent that headship rates among various age groups stabilize, household formation can be expected to more closely follow the growth in adult population. In that regard, the most recent Census Bureau projection for the 18 and older population is about 1% per year, on average, through 2020. In that baseline projection, older age groups tend to have the highest growth rates. Since the older group also has traditionally higher shares of heads of households, this should mean a higher headship rate overall. Given current 12-month annual headship rates by age group, the Census Bureau projections imply household formations averaging on the order of 1.4 to 1.5 million per year through 2020. That compares favorably to an average of a little less than 900,000 annually over the past five years.
Fred Furlong is a group vice president in the Economic Research Department of the Federal Reserve Bank of San Francisco.
References
Bleemer, Zachary, Meta Brown, Donghoon Lee, Wilbert van der Klaauw. 2015. “Debt, Jobs, or Housing: What’s Keeping Millennials at Home?” FRB New York Staff Report 700 (November 2014, revised September 2015).
Adelino, Manuel, Antoinette Schoar, and Felipe Severino. 2012. “Credit Supply and House Prices: Evidence from Mortgage Market Segmentation.” NBER Working Paper 17832, February.
Opinions expressed in FRBSF Economic Letter do not necessarily reflect the views of the management of the Federal Reserve Bank of San Francisco or of the Board of Governors of the Federal Reserve System. This publication is edited by Anita Todd and Karen Barnes. Permission to reprint portions of articles or whole articles must be obtained in writing. Please send editorial comments and requests for reprint permission to research.library@sf.frb.org