
Estimates suggest the new normal for U.S. GDP growth has dropped to between 1½ and 1¾%, noticeably slower than the typical postwar pace. The slowdown stems mainly from demographics and educational attainment. As baby boomers retire, employment growth shrinks. And educational attainment of the workforce has plateaued, reducing its contribution to productivity growth through labor quality. The GDP growth forecast assumes that, apart from these effects, the modest productivity growth is relatively “normal”—in line with its pace for most of the period since 1973.
Economic growth during the recovery has been slower on average than its trend from before the Great Recession, prompting policymakers to ask if there is a “new normal” for U.S. GDP growth.
This Economic Letter argues that the new normal pace for GDP growth, in real (inflation-adjusted) terms, might plausibly fall in the range of 1½ to 1¾%. This estimate is based on trends in demographics, education, and productivity. The aging and retirement of the baby boom generation is expected to hold down employment growth relative to population growth. Further, educational attainment has plateaued, reducing the contribution of labor quality to productivity growth. The slower forecast for overall GDP growth assumes that, apart from these effects, productivity growth is relatively normal, if modest—in line with its pace for most of the period since 1973.
Subdued growth in the labor force
In thinking about prospects for economic growth, it is necessary to distinguish between the labor force and the larger population. Both are expected to grow at a relatively subdued pace; however, because of the aging of the population, the labor force is likely to grow even more slowly than the overall population.
Figure 1 shows that growth in the labor force has varied substantially over time and has often diverged from overall population growth. In the 1950s and 1960s, population (yellow line) grew more rapidly than the working-age population ages 15 to 64 (blue line) or the labor force (red line). In contrast, in the 1970s and 1980s, the labor force grew much more rapidly than the population as the baby boom generation reached working age and as female labor force participation rose. Those drivers of labor force growth largely subsided by the early 1990s. Since then, the labor force, working-age population, and overall population have all seen slower growth rates. Labor force participation fell sharply during the Great Recession, which held down labor force growth. But labor force growth has since rebounded to roughly the pace of the working-age population.
Figure 1
Slowing growth in working-age population and labor force
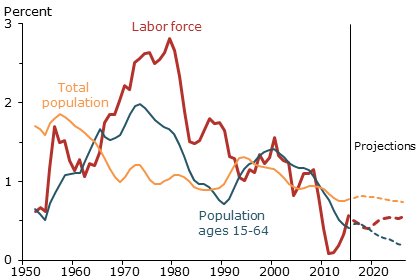
Source: Bureau of Labor Statistics, Bureau of Economic Analysis, Census Bureau, Congressional Budget Office (labor force projections).
Future labor force growth is likely to remain low for a couple of reasons. First, as shown in Figure 1, the population is now growing relatively slowly, and census projections expect that slow pace to continue. Second, these projections also suggest the working-age population will grow more slowly than the overall population, reflecting the aging of baby boomers. Of course, some of those older individuals will continue to work. Hence, the Congressional Budget Office (CBO) projects the labor force will grow about ½% per year (red dashed line) over the next decade—a little faster than the working-age population, but substantially slower than in the second half of the 20th century. I use their estimate as a basis for my assumption that hours worked will also grow at about ½% per year so that hours per worker do not change much.
Recent slow growth for productivity
Figure 2 shows growth in GDP per hour since 1947 broken into periods to reflect variation in productivity growth. This measure of productivity growth was very fast from 1947 to 1973 but much slower from 1973 to 1995. It returned to a fast pace from 1995 to 2004, but has slowed again since 2004. During the fast-growth periods, productivity growth averaged 2½ to 2¾%. During the slower periods, growth was only 1 to 1¼% and dropped dramatically lower in 2010–2015 (Fernald 2016 discusses this period).
Figure 2
Variation in productivity growth by trend period
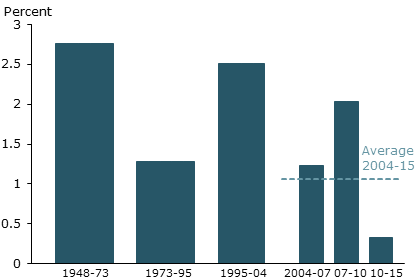
Source: Bureau of Labor Statistics, Bureau of Economic Analysis.
Figure 2 is consistent with the view that the history of productivity growth has shifted between normal periods and exceptional ones (Gordon 2016, Fernald 2015, and David and Wright 2003). Unusually influential innovations—such as the steam engine, electric dynamo, internal combustion engine, and microprocessor—typically lead to a host of complementary innovations that boost productivity growth broadly for a time.
For example, productivity growth was exceptional before 1973, reflecting gains associated with such developments as electricity, the telephone, the internal combustion engine, and the Interstate Highway System (Fernald 1999). Those exceptional gains ran their course by the early 1970s, and productivity growth receded to a normal, modest pace.
Starting around 1995, productivity growth was again exceptional for eight or nine years. Considerable research highlighted how businesses throughout the economy used information technology (IT) to transform what and how they produced. After 2004, the low-hanging fruit of IT had been plucked. Productivity growth returned to a more normal, modest, and incremental pace—similar to that in 1973–95.
The past and future of GDP growth
GDP growth is the sum of growth in worker hours and GDP per hour. The blue line in Figure 3 shows how GDP growth fluctuated on average for each period mentioned in Figure 2. Before 2005, GDP growth since World War II was typically 3 to 4%. The dashed lines in the figure show two projections for future GDP. The higher estimate assumes productivity growth will return to its 1973–95 pace in the long run, while hours grow at the ½% per year pace projected by the CBO. In this scenario, GDP growth would average about 1¾%.
Figure 3
GDP scenarios with low labor force growth
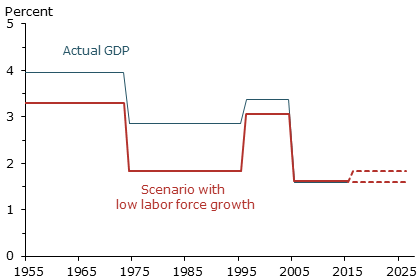
Note: Annual percent change averaged over periods from Figure 2.
Source: Bureau of Labor Statistics, Bureau of Economic Analysis, and author’s calculations.
But productivity growth could easily be lower than in the 1973–95 period for two main reasons. First, productivity has grown a little more slowly from 2004–15 than in the 1973–95 period—and much more slowly since 2010 (Figure 2). Second, and perhaps more importantly, future educational attainment will add less to productivity growth. In recent decades, educational attainment of younger individuals has plateaued. This reduces productivity growth via increases in labor quality, which measures the combined contribution of education and experience. Labor quality has added about 0.4 percentage point to annual productivity growth since 1973. However, by early next decade, labor quality will contribute only about 0.10 to 0.20 percentage point to annual productivity growth (Bosler et al. 2016).
On its own, then, reduced labor quality growth suggests marking down productivity and GDP projections by at least two-tenths of a percentage point and possibly more. The lower dashed line in Figure 3 shows future GDP growth assuming that productivity growth net of labor quality grows at its 1973–95 pace, while labor quality grows at the slower pace of 0.2%. By this projection, GDP growth per hour would be only a little above 1½%.
At first glance, a pace of 1½ to 1¾% seems very low relative to history. But the main reason for the slow pace is demographics: Growth in the 1973–95 period would have been equally slow had hours grown only ½% per year. The red line shows how fast GDP would have grown in that scenario, holding productivity growth at its actual historical pace by period but using the slower pace of growth for hours that the CBO expects in the future. For example, in the 1973–95 period, GDP grew at nearly a 3% pace. But if hours had grown only ½% per year, then GDP growth would have been about 1¾%.
The major source of uncertainty about the future concerns productivity growth rather than demographics. Historically, changes in trend productivity growth have been unpredictable and large. Looking ahead, another wave of the IT revolution from machine learning and robots could boost productivity growth. Or, as Fernald and Jones (2014) suggest, the rise of China, India, and other countries as centers of frontier research might lead to more innovation. In such a case, as Fernald (2016) discusses, the forecast here could reflect an extended pause before the next wave of transformative productivity growth. But, until such a development occurs, the most likely outcome is a continuation of slow productivity growth.
Conclusions
Once the economy recovers fully from the Great Recession, GDP growth is likely to be well below historical norms, plausibly in the range of 1½ to 1¾% per year. The preferred point estimate in Fernald (2016), who examines these issues in even more detail, is for 1.6% GDP growth. This forecast is consistent with productivity growth net of labor quality returning over the coming decade to its average pace from 1973–95, which is a bit faster than its pace since 2004. In the past we have seen long periods with comparably modest productivity growth. But we have not experienced such modest productivity growth combined with the types of changes in demographics and labor quality that researchers are expecting.
This slower pace of growth has numerous implications. For workers, it means slow growth in average wages and living standards. For businesses, it implies relatively modest growth in sales. For policymakers, it suggests a low “speed limit” for the economy and relatively modest growth in tax revenue. It also suggests a lower equilibrium or neutral rate of interest (Williams 2016).
Boosting productivity growth above this modest pace will depend primarily on whether the private sector can find new and improved ways of doing business. Still, policy changes may help. For example, policies to improve education and lifelong learning can help raise labor quality and, thereby, labor productivity. Improving infrastructure can complement private activities. Finally, providing more public funding for research and development can make new innovations more likely in the future (Jones and Williams, 1998).
John Fernald is a senior research advisor in the Economic Research Department of the Federal Reserve Bank of San Francisco.
References
Bosler, Canyon, Mary C. Daly, John G. Fernald, and Bart Hobijn. 2016. “The Outlook for U.S. Labor-Quality Growth.” FRB San Francisco Working Paper 2016-14.
David, Paul, and Gavin Wright. 2003. “General Purpose Technologies and Productivity Surges: Historical Reflections on the Future of the ICT Revolution.” In The Economic Future in Historical Perspective, eds. Paul A. David and Mark Thomas. Oxford: Oxford University Press.
Fernald, John G. 1999. “Roads to Prosperity? Assessing the Link between Public Capital and Productivity.” American Economic Review 89(3), pp. 619–638.
Fernald, John G. 2016. “Reassessing Longer-Run U.S. Growth: How Low?” FRB San Francisco Working Paper 2016-18.
Fernald, John G., and Charles I. Jones. 2014. “The Future of U.S. Economic Growth.” American Economic Review Papers and Proceedings 104(5, May), pp. 44–49.
Gordon, Robert. 2016. The Rise and Fall of American Growth: The U.S. Standard of Living since the Civil War. Princeton, NJ: Princeton University Press.
Jones, Charles I., and John C. Williams. 1998. “Measuring the Social Return to R&D.” Quarterly Journal of Economics 113(4), pp. 1119–1135.
Williams, John C. 2016. “Monetary Policy in a Low R-star World.” FRBSF Economic Letter 2016-23 (August 15).
Opinions expressed in FRBSF Economic Letter do not necessarily reflect the views of the management of the Federal Reserve Bank of San Francisco or of the Board of Governors of the Federal Reserve System. This publication is edited by Anita Todd and Karen Barnes. Permission to reprint portions of articles or whole articles must be obtained in writing. Please send editorial comments and requests for reprint permission to research.library@sf.frb.org