
The natural rate of unemployment, or u-star, is used by economists and policymakers to help assess the overall state of the labor market. However, the natural rate is not directly observable and must be estimated. A new statistical approach estimates the natural rate over the past 100 years. Results suggest the natural rate has been remarkably stable over history, hovering between 4.5 and 5.5% for long periods, even during the Great Depression. Recent readings on the unemployment rate have been running slightly below the natural rate estimate.
The natural rate of unemployment, or u-star, is the hypothetical unemployment rate that is consistent with stable inflation and aggregate production being at its long-run level. This key concept in macroeconomics is used to assess the amount of slack in the labor market and therefore to help evaluate the appropriate stance of monetary policy.
However, estimating the natural rate of unemployment is notoriously difficult. It is not observable and researchers have to find ways to estimate it. Some use statistical methods that infer u-star directly from the Phillips curve—the negative relationship between changes in inflation and labor market slack—as in Staiger, Stock and Watson (1997). Some approaches use the Phillips curve in the context of more elaborate macroeconomic models, as in Galí, Smets, and Wouters (2012). These approaches share a common desire to isolate the underlying slow-moving components of unemployment fluctuations that are consistent with stable inflation and growth.
In this Letter, we use a novel statistical approach to remove cyclical fluctuations in the unemployment rate and retain its more secular components, consistent with the definition of u-star. We estimate u-star using historical data going back to 1890, and find that the natural rate has remained remarkably stable over the past 100 years. Recent readings on the unemployment rate have been running slightly below our natural rate estimate.
Methodology
The Phillips curve captures the aggregate supply relation of an economy, that is, the relation linking the level of production with business pricing decisions. In its typical specification, the Phillips curve describes how inflation fluctuates whenever unemployment deviates from its natural rate. As aggregate demand fluctuates over time, labor market slack and inflation move in opposite directions: Lower unemployment is associated with a higher inflation rate, and vice versa. Other factors can affect the Phillips curve, however. One such factor is changes in the public’s expectation of future inflation. These expectations determine prices for a variety of transactions that will take place in the future and that need a benchmark value. Another typical factor are cost-push shocks, such as sharp increases in the price of oil. Increases in inflation expectations or cost-push shocks can shift the Phillips curve upward, implying a higher level of inflation for the same degree of labor market slack.
Our new approach is based on this relationship between inflation and the gap between the unemployment rate and its natural level. Holding inflation expectations and cost-push factors constant, fluctuations in inflation should correspond to fluctuations in this gap and therefore provide information about the underlying value of the natural rate over time.
Using this intuition, we isolate cyclical fluctuations in the unemployment rate using a statistical method introduced in Cogley and Sargent (2005), known as a time-varying parameter vector autoregressive model. This method has the virtue of using information flexibly, that is, it imposes minimal assumptions on the data. Specifically, our statistical model describes the dynamics of inflation and the unemployment rate. The design of the model captures the interplay between factors that shift the Phillips curve versus factors that cause movements along the Phillips curve. Figure 1 provides a stylized version of what we have in mind. Movements in aggregate supply (red arrow) caused by changes in inflation expectations or cost-push shocks will shift the Phillips curve, while movements in aggregate demand (blue arrow) will move inflation along a downward sloping Phillips curve.
Figure 1
Effects of supply and demand shocks on Phillips curve
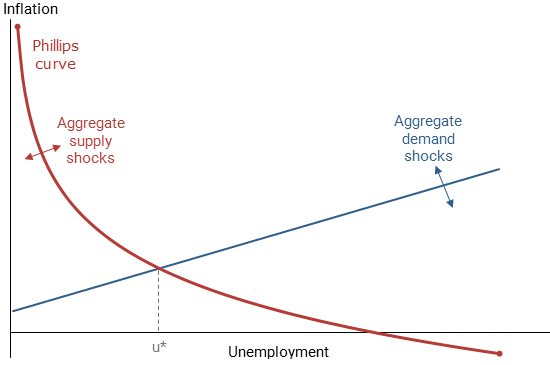
We estimate the natural rate of unemployment (u*) to be the forecast of the unemployment rate expected to prevail over the long run given the current state of the economy. Intuitively, after the shocks affecting the economy dissipate, the unemployment rate will settle to its natural level. Long-horizon forecasts focus on this process by setting aside the short-lived sources of cyclical fluctuations. In the context of Figure 1, this forecasting exercise is equivalent to inferring the intersections of the two curves once they have shifted back to their long-run locations.
The virtue of our flexible statistical model relative to other popular but less flexible alternatives is that our estimate of u-star can vary over time. Such variation could be explained by changes in labor market regulation, demographic factors, and other reasons unrelated to the business cycle.
Compared with previous efforts to infer u-star, our novel approach has a number of advantages. Our setup explicitly recognizes the potential time-varying nature of the natural rate itself, the underlying structure of the economy, and the shocks hitting the economy. In addition, we allow inflation expectations to evolve accordingly. This is particularly important to capture changes in the natural rate during the 1970s and 1980s, when sharp movements in oil prices and overall inflation led to large fluctuations in inflation expectations. While traditional approaches control for changes in inflation expectations using survey measures (as in Coibion and Gorodnichenko 2015), such surveys are only available for the recent past and not over the long sample we consider. Our approach addresses this limitation by implicitly modeling inflation expectations.
Results
We use historical data compiled by Ramey and Zubairy (2017) on unemployment and inflation measured by the GDP deflator spanning 1890 to 2014. We posit that the effect of business cycle shocks dies out after 10 years, so we estimate u-star from the average value of the model’s 10-year ahead forecast of unemployment. Note that, in contrast to more traditional models, our forecasts do not revert to a fixed value but rather to a slowly evolving trend estimated from the data as well. Figure 2 reports the results from this exercise. Figure 3 plots the behavior of the estimate of u-star from the Congressional Budget Office (CBO) to provide a benchmark to compare with our estimates. In both graphs, the blue shaded area denotes the 90% confidence region, an estimate of the uncertainty surrounding the natural rate path.
Figure 2
Headline unemployment and natural rate estimate
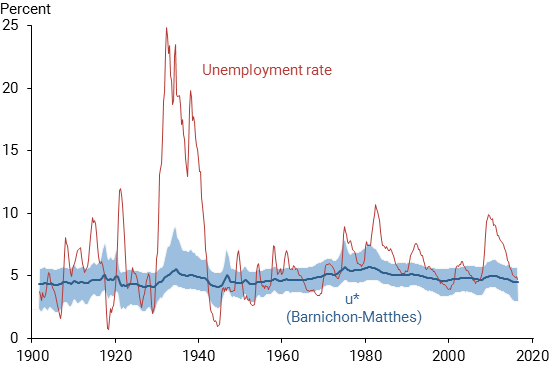
Note: Shaded area indicates 90% confidence region.
Figure 3
Natural unemployment estimate and CBO benchmark
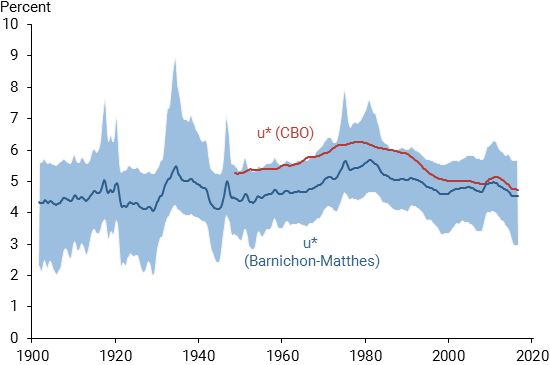
Note: Shaded area indicates 90% confidence region.
The most interesting aspect of our estimated u-star is its remarkable stability over time, ranging between 4.5 and 5.5% over the past 100 years. In particular, the large movements in the unemployment rate during the Great Depression do not feed through to the natural rate as much as one might expect. Despite an increase in unemployment of more than 22 percentage points, shown by the spike in the red line in Figure 2, our estimate of the natural rate shows only a transitory increase of 1 percentage point. There are two main reasons. First, inflation declined rapidly following the increase in unemployment, signaling a large unemployment gap and thus no large increase in u-star. Second, in the early 1940s, unemployment reverted rapidly to its mid-1920s level, indicating an absence of slow movements in u-star during the 1930s. In other words, our model interprets the Great Depression as the realization of very large negative cyclical shocks but not structural changes. In a similar vein, World War II had little effect on the natural rate, even though the actual unemployment rate dropped rapidly to a record low of less than 1%. The reason again is that the behavior of inflation was consistent with the prediction of a stable Phillips curve: In the aftermath of the tight labor market of World War II, inflation rose markedly, as predicted by the tightening of the labor market, so that the model does not need to adjust the natural rate to fit the joint behavior of unemployment and inflation. The same reasoning explains the absence of movements in u-star during World War I.
Shifting to the post-war period, u-star displays an inverse U-shaped behavior from 1960 to 2000, increasing and then decreasing by about 1 percentage point, in line with the CBO’s estimate. This secular trend in unemployment has been emphasized before and to a large extent is the result of the aging of the baby boom generation: Since young workers have a higher unemployment rate than older workers, the aggregate unemployment rate will rise and then fall as the large baby boom generation goes through its life cycle (see Shimer 1999 and Barnichon and Mesters 2017).
During the Great Recession, our statistical model detects a temporary increase in u-star of about 0.4 percentage point that closely matches that of the CBO benchmark estimate. This increase has been attributed to the extension of unemployment insurance benefits; our estimate based on macroeconomic data lines up well with other recent estimates of the effects of those benefit extensions that rely on individual responses to changes in benefit duration (for example, Farber and Valletta 2015). Finally, our model indicates that the unemployment rate is slightly below our estimated natural rate in recent months. Although our u-star estimate was historically about 1 percentage point lower than the CBO’s estimate, the two series have converged and are now very close, increasing our confidence in both methods’ current estimates of slack.
Conclusion
In this Letter, we present a new method to estimate the natural rate of unemployment over the past 100 years. The natural rate has been remarkably stable, ranging between 4.5 and 5.5%. Recent readings on the unemployment rate have been running slightly below our estimated natural rate, implying the elimination of labor market slack.
Regis Barnichon is a research advisor in the Economic Research Department of the Federal Reserve Bank of San Francisco.
Christian Matthes is a senior economist in the Economic Research Department of the Federal Reserve Bank of Richmond.
References
Barnichon Regis, and Geert Mesters. 2017. “On the Demographic Adjustment of Unemployment.” Review of Economics and Statistics, available online.
Cogley, Timothy, and Tom Sargent. 2005. “Drift and Volatilities: Monetary Policies and Outcomes in the Post WWII U.S.” Review of Economic Dynamics 8(2, April), pp. 262–302.
Coibion Olivier, and Yuriy Gorodnichenko. 2015. “Is The Phillips Curve Alive and Well After All? Inflation Expectations and the Missing Disinflation.” American Economic Journal: Macroeconomics 7, pp. 197–232.
Farber, Henry, and Robert Valletta. 2015. “Do Extended Unemployment Benefits Lengthen Unemployment Spells? Evidence from Recent Cycles in the U.S. Labor Market.” Journal of Human Resources 50(4), pp. 873–909.
Galí, Jordi, Frank Smets, and Rafael Wouters. 2012. “Unemployment in an Estimated New Keynesian Model.” NBER Macroeconomics Annual 2011, volume 26(1). Chicago: NBER and University of Chicago Press, pp. 329–360.
Ramey, Valerie, and Sarah Zubairy. 2017. “Government Spending Multipliers in Good Times and in Bad: Evidence from U.S. Historical Data.” Journal of Political Economy, forthcoming.
Shimer, Robert. 1999. “Why Is the U.S. Unemployment Rate So Much Lower?” In NBER Macroeconomics Annual 1998, eds. Ben S.Bernanke and Julio J. Rotemberg. Cambridge, MA: MIT Press.
Staiger, Douglas, James Stock, and Mark Watson. 1997. “How Precise Are Estimates of the Natural Rate of Unemployment?” Chapter in Reducing Inflation: Motivation and Strategy, eds. Christina Romer and David Romer. Chicago: NBER and University of Chicago Press, pp. 195–246.
Opinions expressed in FRBSF Economic Letter do not necessarily reflect the views of the management of the Federal Reserve Bank of San Francisco or of the Board of Governors of the Federal Reserve System. This publication is edited by Anita Todd and Karen Barnes. Permission to reprint portions of articles or whole articles must be obtained in writing. Please send editorial comments and requests for reprint permission to research.library@sf.frb.org