
Slowing growth in U.S. productivity after 2004 is sometimes blamed on measurement problems, particularly in assessing the gains from innovation in IT-related goods and services. However, mismeasurement also occurred before the slowdown and, on balance, there is no evidence that it has worsened. Some innovations—such as free Internet services—have grown increasingly important, but they mainly affect leisure time. Moreover, the non-market benefits do not appear large enough to offset the effects of the business-sector slowdown.
Innovation is an important driver of economic growth. One of the most striking areas of ongoing innovation is information technology (IT)—including mobile hardware, software, and cloud services. Yet, despite the remarkable pace of IT innovation, the slow pace of U.S. productivity growth since the early 2000s has disappointed many observers.
This Letter reviews arguments from our paper (Byrne, Fernald, and Reinsdorf 2016) exploring whether the apparent productivity slowdown after 2004 reflects rising challenges in measuring IT-related innovations. Importantly, for mismeasurement to explain the productivity slowdown, growth must be mismeasured by more than it was in the past. Although we find considerable evidence of mismeasurement, we find no evidence that, on balance, the understatement of IT’s contribution to productivity growth has gotten worse since the early 2000s. Overall, while measurement challenges are real and there is considerable uncertainty, our evidence suggests that slower growth does not simply reflect mismeasurement.
Slow productivity growth and some measurement challenges
In our study, we focus primarily on IT-related innovation because it is the obvious area of rapid technological change, as well as an area where measurement challenges are thorny. We apply recent research that seeks to provide consistent, improved estimates of IT-related production.
Figure 1 summarizes the components of our productivity adjustments separated into three periods. The dark blue portions of the bars show the published data on average growth in business-sector labor productivity, that is, real output per hour. Productivity growth was exceptional from 1995 through 2004 but has since slowed by about 1¾ percentage points per year. If productivity growth had continued at its 1995–2004 pace then, holding hours growth unchanged, business-sector output would have been 24% larger.
Figure 1
Published and adjusted U.S. labor productivity
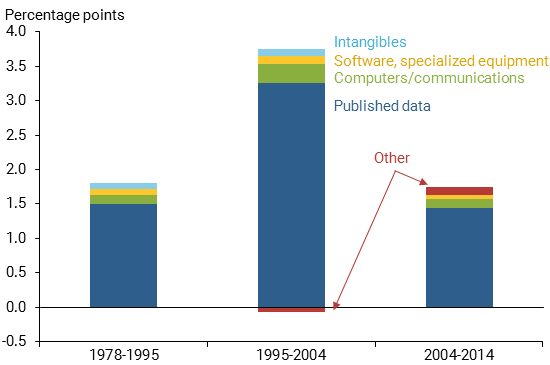
Source: Bureau of Labor Statistics, Fernald 2014, and authors’ calculations. “Other” includes Internet, free digital services, globalization, and fracking.
The bars also quantify several potential sources of mismeasurement. The main challenge is determining the prices used to deflate nominal expenditures, since they need to adjust for changing quality over time. For example, when you buy a new computer it could cost the same as your previous one but might be much more powerful—with a faster processor, better image quality, and more memory. The true price of the computer has dropped to account for your spending the same nominal amount for a better computer. Adjusting for quality change is challenging: If the statistics do not incorporate enough of an adjustment for quality, then we also do not measure the full increase in the inflation-adjusted real quantity produced.
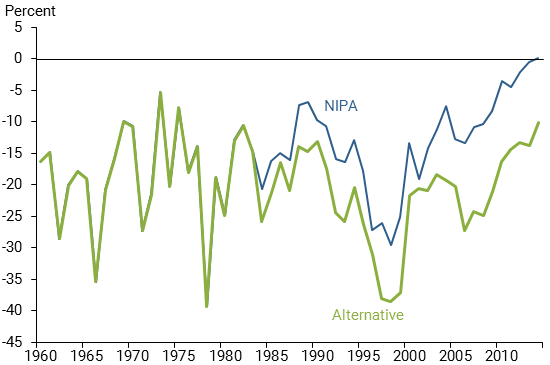
The first issue we consider in our study is consistent measurement of quality-adjusted prices for computers and communications equipment. Figure 2 shows the official estimate from the National Income and Product Accounts and our preferred alternative estimate of quality-adjusted inflation for computers based on Byrne and Corrado (2016). Inflation is usually negative since quality improvements have pushed computer prices down rapidly over time. Both measures show faster price declines in the late 1990s than more recently. But the gap between the two, which reflects computer price mismeasurement, is larger in the recent period. As a result, given nominal expenditure on computers, our alternative deflator implies faster growth in real, inflation-adjusted quantities. In other words, mismeasurement of computer prices has worsened since 2004 because quality has improved faster than the official statistics would suggest. We find similar results for communications equipment.
Figure 2
Official and alternative computer prices
Despite the rising price mismeasurement, the effect on inflation-adjusted production—which directly affects both real GDP and business-sector productivity—is smaller since 2004 than it was in 1995–2004. The reason is that domestic production of computers and communications equipment has plunged. As a result, using improved price indexes adds more to “true” growth in the 1995–2004 period (almost 0.3 percentage point per year) than more recently (about 0.10 percentage point per year).
A second adjustment is for prices of software and specialized information-processing equipment, such as medical scanners or specialized defense electronics. These products have grown in importance over time, both as a share of capital investment and in terms of domestic production. However, the official data only partially adjust for quality changes. Thus, it is likely that the rate of price change for these products is overstated. Unlike computers, there is little formal research on specialized equipment in this area so the adjustments are more speculative.
For example, specialized equipment such as an MRI machine looks a lot like a high-powered computer in terms of its electronic content. But, while computer prices have been falling, as shown in Figure 2, the official price deflators for specialized equipment have been rising. We adjust specialized equipment prices to account for their electronic content. Unlike computers or communications equipment, our 1995–2004 price correction is larger because quality-adjusted prices for computers fell faster in absolute terms in the 1990s than in recent years. Even after accounting for the rising share in domestic production, the productivity correction is a touch larger in 1995–2004 than more recently.
For software, the adjustment turns out to be similar for both periods. Our alternative deflator (and an updated one from Byrne and Corrado 2016) falls faster than the official one in both periods. The estimated mismeasurement is fairly similar as well; even with domestic production weighted a touch higher for software in the most recent period, it causes little change in the mismeasurement of output and productivity. As Figure 1 shows, the combined effect of adjusting prices for specialized equipment and software raises productivity growth a bit more in 1995–2004 than more recently, but the difference is small on balance. In other words, the slowdown in productivity growth is almost unaffected by adjusting specialized equipment and software.
A third adjustment is for intangible investments that are not currently included in the national accounts. Conceptually, capital investment by businesses represents spending today to increase future revenue. The U.S. national accounts include some intangible investments, namely, software, research and development, and artistic originals. However, businesses undertake other similar spending, such as training, reorganizations, and brand-building advertising. One hypothesis suggests that businesses are investing in organizational changes and learning that will pay off in future growth—in other words, we might be seeing a “constructive pause” in productivity growth.
Figure 1 includes an adjustment for additional intangibles, using data from Corrado and Jäger (2015). That adjustment adds about 0.1 percentage point to growth in the 1995–2004 period, since these intangibles were growing more quickly than measured output. After 2004, however, the intangibles adjustment is not visible in Figure 1, because they are growing only as fast as measured output. This does not entirely rule out the view that the slow pace is a constructive pause, but we do not yet observe the spending.
Other adjustments to business output and productivity
The remaining “other” adjustments in Figure 1 involve estimates of other potential sources of business-sector mismeasurement. Taken together, these adjustments for Internet access, e-commerce, globalization, and fracking subtract somewhat from productivity in the 1995–2004 period and add somewhat to the more recent period. These adjustments thus reduce the magnitude of the slowdown a bit, although the effect is not large.
One adjustment is to Internet access prices to control for improved download speeds and access to more websites. This adjustment uses a quality index from Brynjolfsson and Oh (2014) and modestly raises productivity in each period. An adjustment for e-commerce modestly boosts true business output and productivity growth by increasing product variety.
Finally, fracking and globalization are two non-IT areas we consider. Fracking is a technological innovation that allows drillers to access lower-quality natural resources. Unmeasured aspects of this innovation may raise true aggregate labor and total factor productivity growth around 0.05 percentage point per year since 2004. For globalization, import price declines from offshoring and related changes in import sourcing are largely missing in the official statistics. As a result, true import growth is understated in the late 1990s and early 2000s, when China’s trade was expanding rapidly; correspondingly, growth in domestic GDP and labor productivity are overstated. This explains why the “other” region in Figure 1 is, on net, negative from 1995 to 2004.
Taken all together, the adjustments shown in Figure 1 make the labor productivity slowdown after 2004 modestly larger than measured, not smaller.
“Free” digital services
Intuitively, many of the great innovations of the past decade involve the services of Google, Facebook, Wikipedia, and the like, which have quickly become part of everyday life. If using these services makes businesses more efficient, that productivity benefit is already counted. However, the slow pace of business productivity suggests that these services have not yet significantly improved business efficiency.
For consumers, though, these services clearly enhance non-market leisure time and home production. This is important and valuable—our lives extend far beyond the borders of the market. Nevertheless, increases in household productivity for non-market services have never been counted in GDP and do not represent improved business productivity. For example, going to the library in your spare time to look up information has never been included in the value of business-sector GDP, though the value of printed books was included. Correspondingly, looking up information on Wikipedia is not included in business-sector GDP, though the smartphone and Internet access is. Our study suggests it is not appropriate to account for more than a small amount of these services in our measures of market output. Moreover, even the largest estimates of the non-market gains to well-being are too small to fill the large gap from the business-sector productivity slowdown (see also Syverson 2016).
Conclusion
Despite ongoing IT-related innovation, aggregate U.S. productivity growth slowed markedly after about 2004. Some observers (such as Hatzius 2016) argue that some of this discrepancy might reflect mismeasurement. Although we find evidence of substantial IT-related mismeasurement of growth, that mismeasurement does not appear to have increased over time. Indeed, despite some offsetting effects, the net effect appears a bit larger in the period before 2004. Hence, the productivity slowdown remains sizable.
If not mismeasurement, why did productivity growth slow? Fernald (2015, 2016) argues that, in the past 40 years, the real anomaly is the fast growth from 1995 to 2004. A number of changes came together around the same time, including the emergence of the Internet and reorganization of distribution and other sectors. As a result, businesses throughout the economy transformed how they operated and became more efficient. We might see another such period in the future, perhaps reflecting cloud computing, the Internet of things, and the radical increase in mobility from smartphones. However, we have not yet seen those gains.
Nevertheless, much of the discussion has merely scratched the surface. More research on specialized equipment and software and emerging digital services is needed to fully account for IT-related improvements. Beyond IT, health care and other services have never been well measured. These areas do not appear to be the culprit in the post-2004 slowdown. But as their share of the economy grows, our certainty about true economic activity correspondingly falls.
David Byrne is a principal economist at the Board of Governors of the Federal Reserve System.
John G. Fernald is a senior research advisor in the Economic Research Department of the Federal Reserve Bank of San Francisco.
Marshall Reinsdorf is a senior economist at the International Monetary Fund.
References
Brynjolfsson, Erik, and Joo Hee Oh. 2014. “The Attention Economy: Measuring the Value of Free Digital Services on the Internet.” Research project.
Byrne, David M., and Carol Corrado. 2016. “ICT Asset Prices: Marshaling Evidence into New Measures.” The Conference Board Economics Program Working Paper 2016-06.
Byrne, David M., John G. Fernald, and Marshall B. Reinsdorf. 2016. “Does the United States have a Productivity Slowdown or a Measurement Problem?” Brookings Papers on Economic Activity, Spring, pp. 109–157.
Corrado, Carol, and Kirsten Jäger. 2015. “Wealth and Investment in Mature Societies.” Presentation at Milestone 3: Midterm Conference, Smart Public INTANgibles (SPINTAN), London, April 23–24.
Fernald, John G. 2014. “A Quarterly, Utilization-Adjusted Series on Total Factor Productivity.” FRB San Francisco Working Paper 2012-19, revised April 2014.
Fernald, John G. 2015. “Productivity and Potential Output before, during, and after the Great Recession.” In NBER Macroeconomics Annual 2014, eds. Jonathan A. Parker and Michael Woodford. Chicago: University of Chicago Press, pp. 1–51.
Fernald, John G. 2016. “Reassessing Longer-Run U.S. Growth: How Low?” FRB San Francisco Working Paper 2016-18.
Hatzius, Jan. 2016. “Productivity Paradox v2.0 Revisited.” Goldman Sachs Global ECS Research US Economics Analyst, September 2.
Syverson, Chad. 2016. “Challenges to Mismeasurement Explanations for the U.S. Productivity Slowdown.” National Bureau of Economic Research Working Paper 21974.
Opinions expressed in FRBSF Economic Letter do not necessarily reflect the views of the management of the Federal Reserve Bank of San Francisco or of the Board of Governors of the Federal Reserve System. This publication is edited by Anita Todd and Karen Barnes. Permission to reprint portions of articles or whole articles must be obtained in writing. Please send editorial comments and requests for reprint permission to research.library@sf.frb.org