Consumer attitudes about buying and selling homes can inform us about future housing and mortgage markets. The Home Purchase Sentiment Index (HPSI) summarizes data from the National Housing Survey on consumers’ conditions, attitudes, and intentions about housing. The HPSI shows promise both as a stand-alone indicator and as a supplement for evaluating and forecasting housing and mortgage markets. Analysis reveals the index accurately projected strong home sales in 2014 and 2015 and a weaker outlook toward the end of 2016, following the sharp rise in mortgage interest rates.
Homeownership has long been important for our personal lives and our finances. The Great Recession and the sluggish U.S. recovery reinforced the judgment that housing has an important effect on job markets, the financial sector, and the national economy. A better understanding of what affects housing and mortgage markets should thus improve policies and forecasts for the larger economy.
This Letter discusses a new tool that translates surveys of consumer sentiment about housing and mortgage markets into a quantitative measure, known as the Home Purchase Sentiment Index (HPSI). Analysis shows that the HPSI contains information about current and future housing market outcomes that is distinct from indexes of general consumer sentiment. Its recent record suggests that the HPSI can help improve housing and mortgage market forecasts.
Measuring sentiment about housing
Timely detection of shifts in consumer perspectives may be especially valuable for housing and mortgage markets because they involve long-term commitments that can be expensive to undo. Thus, consumer decisions about whether and when to buy or sell homes inevitably depend on their expectations about future house prices, mortgage rates, income, and other developments.
Relative to objective data, surveys may provide better signals sooner about how consumers react to ongoing developments and recent news about the economy and about changes in their expectations for the future. Traditionally, economic data objectively measure what happened in the past: They tell us the way we were. By contrast, surveys can inform us more about what we think and what we expect. Surveys can also measure more directly and quickly the repercussions of recent developments on the consumer attitudes that affect their decisions and actions. As such, consumer surveys might improve forecasts of consumer spending, business investment, labor costs, inflation, bond yields, and monetary policy.
In 2010, Fannie Mae began collecting data for a wide range of consumer attitudes related to housing and mortgage markets through its monthly National Housing Survey (NHS). The NHS asks a nationally representative sample of 1,000 consumers about 100 questions. Based on the survey responses, Qiang Cai, Steve Deggendorf, and I developed a single indicator known as the Home Purchase Sentiment Index (HPSI). This indicator effectively and efficiently distills NHS information from consumers into a quantitative measure that offers insights that are distinct from those in indexes of general consumer sentiment. Detailed analysis about the construction and performance of the HPSI can be found in Cai, Deggendorf, and Wilcox (2015).
Calculating the Home Purchase Sentiment Index
We construct the HPSI from consumers’ answers to six NHS questions about housing markets and other factors pertinent to home purchase decisions. We selected questions based on their correlations with future housing outcomes and on our judgments. The six questions ask consumers whether they think that it is a good time to buy a house or to sell a house, what direction they expect home prices and mortgage interest rates to move, how concerned they are about losing their jobs, and whether their incomes are higher than they were a year earlier. Each month’s HPSI is calculated by taking the average across the six questions of the net percent of answers that were positive. To make comparisons with other measures of consumer sentiment easier, the initial value for the HPSI is set equal to 60 for March 2011.
HPSI and its components, 2011–2016
Figure 1 shows the HPSI (blue line), as well as consumers’ views about whether it was a good time to buy or sell homes and whether house prices were expected to rise. At first, the HPSI moved very little. Then, from the autumn of 2011 until the middle of 2013, the HPSI rose quite steadily and substantially. Over that time, the percent of consumers saying it was a good time to buy a home increased, as did the percent expecting house prices to go up. And, though still in the minority, more and more consumers responded that it was a good time to sell homes.
Figure 1
The HPSI and consumer views about housing markets
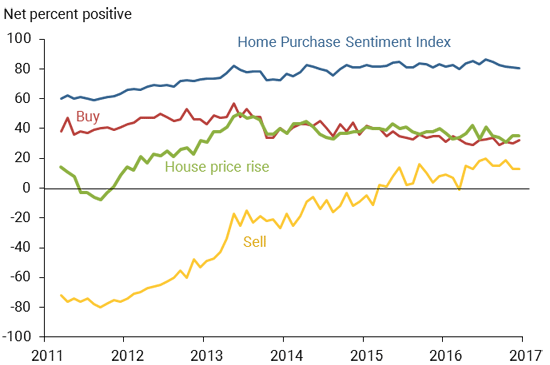
Following the “taper tantrum” that roiled bond and mortgage markets in mid-2013, the HPSI declined considerably through the end of the year. From then until the HPSI peaked in July 2016, it fluctuated mildly but generally trended upward, in part because the increase in responses that it was a good time to sell more than offset the decrease in responses that it was a good time to buy a home. Figure 1 shows that declines in these three components contributed to the downward drift of the HPSI through the end of 2016.
Home purchase sentiment vs. overall sentiment
It’s useful to know whether the HPSI sends signals about housing that are different from other indexes of sentiment and whether its signals can reliably forecast housing markets. Fortunately, we find that they are and they do. Figure 2 shows the movements since 2011 of the HPSI and of two other venerable measures of overall consumer sentiment about the economy: the Index of Consumer Sentiment (ICS), produced by the University of Michigan Surveys of Consumers, and the Consumer Confidence Index (CCI), produced by the Conference Board. To make it easier to see when each index moved more than usual, I scaled the indexes so that they each fluctuated by the same amount since 2011.
Figure 2
The HPSI and overall sentiment indexes
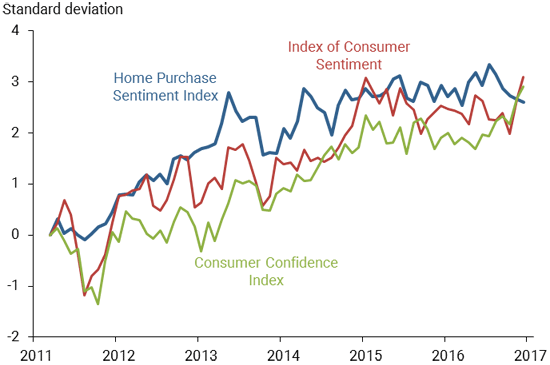
Note: Indexes are adjusted to show changes since March 2011 and to equalize volatility.
As both housing and the overall economy recovered after the Great Recession, all three indexes generally strengthened. The stronger rebound in housing than in the economy as a whole was mirrored by the HPSI strengthening considerably more than the other indexes during its first two years.
The indexes also sometimes diverged noticeably over shorter spans. Not surprisingly, the episodes of divergence often corresponded with sizable shifts in mortgage interest rates, which have especially large effects on housing. As the federal debt ceiling debate grew then was settled in 2011, both overall indexes plummeted then rebounded sharply. In contrast, the HPSI at first strengthened relative to other indexes. The HPSI then weakened a bit when the ceiling was lifted and mortgage markets reversed.
Another divergence occurred when mortgage rates suddenly rose in response to the “taper tantrum” in bond markets in the spring of 2013. The HPSI then quickly and clearly declined. In contrast, overall sentiment clearly weakened only months later. As the tantrum passed and interest rates fell back, the indexes then all resumed their climbs in late 2013. The HPSI rebounded more in the first half of 2014, while the ICS and the CCI rose more in the second half of 2014. Then during 2015, while the HPSI was quite stable, the ICS and the CCI drifted downward somewhat.
The most dramatic divergence has been more recently, presumably due to the national election results in November 2016. The HPSI had already declined considerably from its all-time high in July before the elections. And, it was nearly unchanged after October. In contrast, however, both the ICS and the CCI sprang up in November and December. The election results appear to have boosted expectations for overall economic growth, which can boost overall consumer confidence. The results also boosted interest rates. Mortgage rates rose 0.5 percentage point or more, which may have tempered sentiment about housing in particular.
Housing horse races: How the HPSI helps
To analyze and forecast housing markets, the HPSI may be used as a stand-alone indicator or as a supplement to other indicators. Wilcox (2015) showed that, when used alone, the HPSI helped forecast home sales, housing starts, and mortgage originations over the upcoming year. It also forecast house price growth rates, albeit much less reliably.
To help evaluate the HPSI’s relative performance in forecasting one-year-ahead home sales, housing starts, and mortgage originations, that study also conducted two statistical “horse races.” Each race pitted the HPSI against another measure of household sentiment, either the ICS or an index of sentiment constructed from housing-related questions in the University of Michigan survey. The HPSI won those races, significantly forecasting future housing outcomes, while neither of the other two measures of sentiment significantly improved housing forecasts.
Having an indicator that signaled when to raise or lower forecasts could be very valuable. In Cai et al. (2015) we examined whether recent changes in the HPSI can provide reliable signals about future forecast errors. To do so, we calculated the deviations of actual year-ahead housing outcomes from the average of the real-time forecasts made by several long-established organizations. We found that, if those organizations had raised or lowered their forecasts in line with recent HPSI changes, they generally would have had smaller forecast errors, especially for home sales.
Recent episodes show how the HPSI can help forecast housing. Sales of single-family homes were stronger in 2015 and 2016 than the level of overall consumer sentiment would generally forecast. Over the year before those strong home sales, however, the HPSI was unusually strong relative to the ICS. Thus, in 2014 and 2015 the HPSI was correctly signaling that home sales would be stronger than indicated by overall consumer sentiment.
The HPSI was also strong relative to the ICS in mid-2016, providing signals of further strength in housing in the months to follow. That changed in November and December. While the HPSI changed little from October through December, both the ICS and the CCI surged upward. Of course, the election might augur different prospects for the overall economy than for housing. Expectations of stronger economic growth or infrastructure spending might explain why both overall consumer sentiment and interest rates rose sharply at the end of 2016. And, higher mortgage rates would help explain the weakening of the HPSI, and thus of housing, relative to the indications from overall consumer sentiment.
Assessments of the HPSI’s forecasting performance need to consider that we chose the six component questions based partly on their forecasting performance through 2014. This bias favors the finding that HPSI could help forecasts. In addition, housing markets were anything but typical in the years just before and after the HPSI started in early 2011. Thus, caution is warranted when making conclusions based solely on those years. Ongoing experience will improve our understanding of how best to interpret signals from the HPSI about future housing markets.
Concluding remarks
Over the past two decades, economy-wide factors had unusually large effects on housing. At the same time, housing-specific factors, such as pervasive changes in lending practices and the house price boom and bust, led housing to diverge more than usual from the overall economy. Such times are when housing-specific information, like that distilled into the Home Purchase Sentiment Index, can be most valuable. Those times also give indexes of overall consumer sentiment some advantages over the HPSI for forecasting overall consumer spending.
Despite atypical housing markets and the index’s short history, indications so far are encouraging that the HPSI helps. Since it started in 2011, increases in the HPSI have quite reliably predicted stronger housing markets. And, when evaluated in conjunction with indexes of overall consumer sentiment, the HPSI proved to be a valuable contributor to housing forecasts.
James A. Wilcox is a visiting scholar at the Federal Reserve Bank of San Francisco and a professor at the Haas School of Business at the University of California, Berkeley.
See the most recent Home Purchase Sentiment Index data.
References
Cai, Qiang, Steve Deggendorf, and James A. Wilcox. 2015. “Building a Home Purchase Sentiment Index.”
Wilcox, James A. 2015. “The Home Purchase Sentiment Index: A New Housing Indicator.” Business Economics 50(4), pp. 178–190.
Opinions expressed in FRBSF Economic Letter do not necessarily reflect the views of the management of the Federal Reserve Bank of San Francisco or of the Board of Governors of the Federal Reserve System. This publication is edited by Anita Todd and Karen Barnes. Permission to reprint portions of articles or whole articles must be obtained in writing. Please send editorial comments and requests for reprint permission to research.library@sf.frb.org