
After eight years of economic recovery, inflation remains below the FOMC’s target. Dissecting the underlying price data by spending category reveals that low inflation largely reflects prices that are relatively insensitive to overall economic conditions. Notably, modest increases in health-care prices, which have been held down by mandated cuts to the growth of Medicare payments, have helped moderate overall inflation. Further slow growth in health-care prices is likely to remain a drag on inflation.
Since the end of the recession, inflation has been persistently below the Federal Reserve’s 2% target, with core personal consumption expenditures (PCE) prices rising on average about 1.5%. During this period, researchers have suggested a multitude of explanations for weak inflation, including low energy prices, a strong dollar, and a high degree of labor market slack. However, now that the labor market has fully recovered, the dollar has appreciated, and oil prices are no longer declining as rapidly, Chair Janet Yellen recently said that the reason why inflation remains low is a “mystery” (Yellen 2017).
In this Economic Letter, we examine the factors keeping inflation low by drilling down into inflation rates by spending category. We distinguish between categories where inflation has historically exhibited a procyclical relationship with overall economic conditions, moving in tandem with the economic cycle, and those categories where inflation has been acyclical, that is, driven by category-specific developments that are independent of the state of the overall economy. We show that procyclical inflation has steadily returned to its pre-recession level, in line with improvements in economic conditions and a tightening labor market. However, acyclical inflation has been persistently low, suggesting that idiosyncratic factors have helped hold down PCE inflation.
We show that the key driver holding down acyclical inflation, and hence core PCE inflation, over the past few years has been persistent changes to the health-care sector that began after the end of the recession. Specifically, cuts to Medicare payment growth rates—which can affect prices throughout the health-care sector—have restrained health-care services inflation (Clemens, Gottlieb, and Shapiro 2016). Because health care makes up a large share of PCE, price changes within this sector can have sizable effects on overall PCE inflation. We estimate that low inflation from this sector is currently subtracting about 0.3 percentage point from core PCE inflation, that is the measure that excludes food and energy prices. While health-care services inflation is expected to pick up in the coming years, it appears unlikely to return to its pre-recession level, which could restrain core PCE inflation for the foreseeable future.
Procyclical versus acyclical inflation
The well-known Phillips curve implies that inflation tends to move in the same direction as the overall economy. During good economic times, when the unemployment rate is low, high demand relative to supply causes businesses to raise prices. During recessions, when the unemployment rate is high and there is excess supply, businesses are less apt to raise prices, causing inflation to decline.
We drill down to the categorical level to assess whether inflation for individual categories responds to changes in overall economic activity. This allows us to examine whether some categories’ prices are more sensitive to business cycle conditions than others. For each category we estimate a basic Phillips curve relationship between the unemployment gap—the gap between the national unemployment rate and its long-term or natural rate—and changes in prices for that category, using data from 1985 through 2007. We then place a sector into one of two groups: procyclical or acyclical. If the sector’s inflation rate shows a negative and statistically significant relationship with the unemployment gap, we categorize the sector as procyclical. If the sector does not satisfy this criterion, we categorize the sector as acyclical.
We find that the categories exhibiting a procyclical relationship make up 42% of the PCE and include housing, recreational services, food services, and some nondurable goods. The acyclical categories, which make up the remaining 58%, include health-care services, financial services, clothing, transportation, and some other smaller categories. Based on this categorization, we create two distinct aggregate inflation series. These series are constructed as a weighted sum of inflation rates by sector, which is similar to the method the Bureau of Economic Analysis (BEA) uses to construct its overall PCE price index. While compositional changes can also affect inflation dynamics, these changes have had little impact on movements in the overall PCE index.
Figure 1 shows that the two inflation series occasionally move together. However, there are periods when they have diverged—in the late 1990s through early 2000s and again starting in 2014. In both of these periods, overall inflation was low—1.7% and 1.6%, respectively. In line with the historical relationship, procyclical inflation has steadily increased over the past few years as the recovery continued to gain steam and economic slack diminished further. However, acyclical inflation has gradually declined.
Figure 1
Procyclical and acyclical core PCE inflation
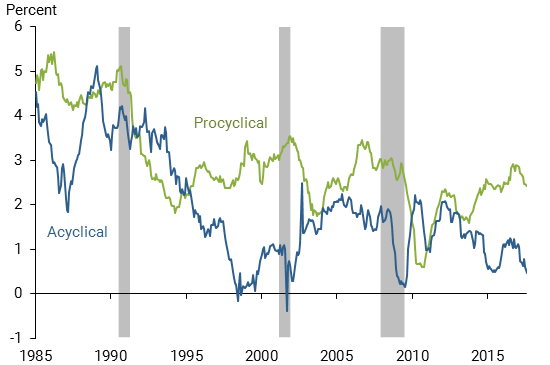
Note: Gray bars indicate NBER recession dates.
The patterns of these two groups suggest that core PCE inflation has been persistently low due to weak acyclical inflation. To get a better sense of how each series affects core PCE inflation we plot their contributions in Figure 2. The contributions to core inflation are calculated by multiplying a change in price for a given category by its most recent respective weight in the overall index. By construction, the sum of the contributions from procyclical and acyclical inflation equals core PCE inflation in each period. We also show as a benchmark the average contribution of each series over the 2002–07 period, represented by the dashed horizontal lines. This period is a useful benchmark because it is the last time the economy was expanding and core PCE inflation averaged 2% for an extended period, reflecting a relatively normal economy.
Figure 2
Contributions to core PCE inflation from procyclical and acyclical sources
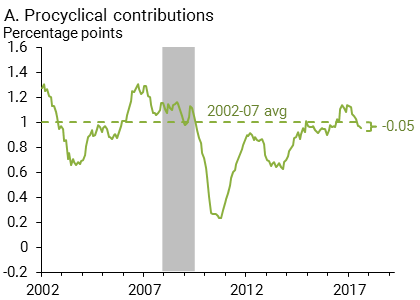
Note: BEA and authors’ calculations.
Procyclical inflation currently contributes about the same amount as it did in 2002–07. However, acyclical inflation is contributing about 0.6 percentage point less than it was during these years. In other words, core PCE inflation would be about 2% if acyclical inflation were behaving as it did in the mid-2000s.
Medicare and the health-care services inflation slowdown
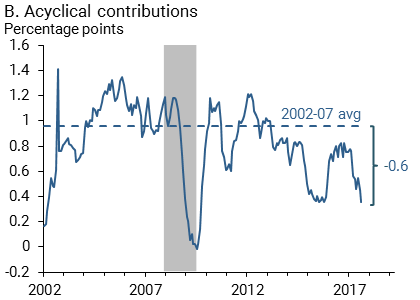
We next assess if there is any particular sector to blame for low acyclical inflation. The first place to look would be the largest sector within the acyclical category, health-care services, which currently accounts for about 35% of acyclical inflation and 20% of the entire core PCE index. In Figure 3 we measure the extent to which health-care services has caused the decline in the acyclical group’s contribution to core PCE inflation in recent years. The black line is the deviation of the contribution of acyclical inflation from its 2002–07 average—that is, from Figure 2, panel B, the blue line minus the dashed horizontal line. In Figure 3, the blue bars represent how much of the acyclical deviation (black line) is attributable to health-care services, and the red bars reflect the contribution from other non-health acyclical categories.
Figure 3
Difference between acyclical contributions and benchmark
Note: Solid line shows deviation of acyclical inflation from its 2002-07 average. Blue bars reflect the weighted contribution to that deviation from health-care services inflation; red bars reflect the combined weighted contributions from other acyclical sectors.
The figure shows that persistently low acyclical inflation since the recession has been driven by the substantial drag from health-care services. By contrast, the other acyclical categories have been bumping above and below their pre-recession levels. The very recent dip during 2017 in the acyclical group’s inflation contribution—and hence core PCE inflation in general—can be traced to a relative decline in the contribution from the acyclical categories that are not related to health care. We found this mainly reflects a steep decline in the prices of cellular phone services.
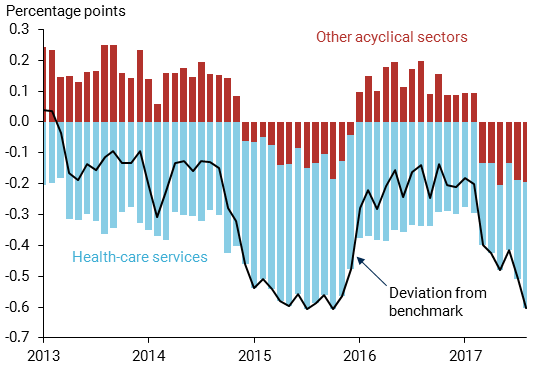
Indeed, health-care services inflation has slowed considerably over time. It averaged around 3.5% in the mid-2000s but has averaged only 1.1% over the past five years. As demonstrated in Figure 4, this has translated into a persistent decline in the contribution of health-care services inflation to core PCE inflation relative to its pre-recession average level. The health-care services category is currently contributing about 0.3 percentage point less to core PCE than in the 2002–07 benchmark. Indeed, were it not for this steady decline in health-care services inflation, core PCE inflation would have hovered above 2% for most of the post-recession period.
Figure 4
Contribution of health-care services inflation to core PCE
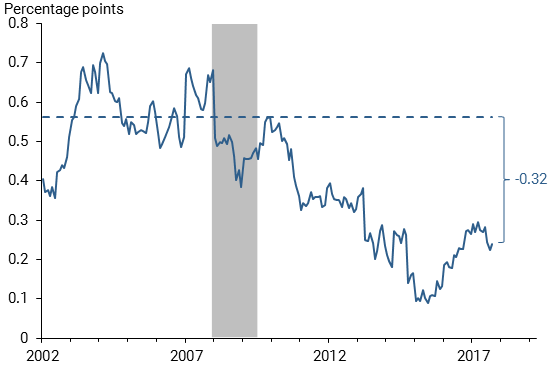
What has been causing this persistent decline in health-care services inflation? A major factor has been legislated changes to Medicare payments. Through various pieces of legislation, including the Affordable Care Act (ACA), the federal government has slowed the growth of Medicare payments to physicians and hospitals. These payments are directly included in the BEA’s health-care services price index, which by construction translates into a slower rate of health-care services inflation. As shown in Clemens and Gottlieb (2016) these legislated changes to Medicare payment growth can also affect the payment growth for private insurers and thus pervade throughout the health-care services sector.
The Centers for Medicare and Medicaid Services (2017) recently published its inpatient Medicare payment schedule for fiscal year 2018. Payments are set to grow at 2.0% in this fiscal year, up from a rate of 0.9% in fiscal year 2016 and 0.6% in fiscal year 2017. Based on past estimates of how Medicare passes through to affect prices of other health-care services, this projected increase could translate into as much as a 0.3 percentage point increase in overall health-care services inflation, albeit only a 0.05 percentage point increase in core PCE inflation. Furthermore, some of the legislated payment growth cuts mandated by the ACA will expire after fiscal year 2019. However, on the whole it seems unlikely that health-care services inflation will reach its pre-recession level given that many of the Medicare payment growth cuts are permanent or set to continue for an extended period (Clemens, Gottlieb, and Shapiro 2016). For example, some spending will be permanently curtailed due to adjustments in economy-wide multifactor productivity and physician payments that are scheduled to stall between 2019 and 2025.
Conclusion
Core PCE inflation has persistently remained below the FOMC’s 2% target despite continued improvement in economic conditions. We note that, while procyclical inflation in categories sensitive to overall economic conditions has returned to its pre-recession level, inflation in categories that are relatively unresponsive to changes in economic conditions remains persistently below its 2002–07 benchmark level.
We attribute much of this persistent weakness in core PCE inflation to cuts in the growth of Medicare payments, which have translated into slower inflation throughout the health-care sector (Clemens, Gottlieb, and Shapiro 2014, 2016). While some cuts are expected to dissipate in the coming years, it seems unlikely that Medicare payment growth will return to its pre-recession level under current legislation. Slower growth in health-care prices is a welcome development for households and businesses that purchase it and for policymakers concerned about financing government health-care programs. However, a potential downside is the resulting diminished contribution to an overall inflation rate that has been below the Federal Reserve’s 2% target for a sustained period.
Tim Mahedy is an associate economist in the Economic Research Department of the Federal Reserve Bank of San Francisco.
Adam Shapiro is a research advisor in the Economic Research Department of the Federal Reserve Bank of San Francisco.
References
Centers for Medicare and Medicaid Services. 2017. Fiscal Year 2018 Medicare Hospital Inpatient Prospective System and Long Term Acute Care Hospital Prospective Payment System Final Rule.
Clemens, Jeff, and Josh Gottlieb. 2017. “In the Shadow of a Giant: Medicare’s Influence on Private Physician Payments.” Journal of Political Economy 125(1), pp. 1–39.
Clemens, Jeff, Josh Gottlieb, and Adam Shapiro. 2014. “How Much Do Medicare Cuts Reduce Inflation?” FRBSF Economic Letter 2014-28 (September 22).
Clemens, Jeff, Josh Gottlieb and Adam Shapiro. 2016. “Medicare Payment Cuts Continue to Restrain Inflation.” FRBSF Economic Letter 2016-15 (May 9).
Yellen, Janet. 2017. “Transcript of Chair Yellen’s Press Conference, September 20, 2017.” Federal Reserve Board of Governors.
Opinions expressed in FRBSF Economic Letter do not necessarily reflect the views of the management of the Federal Reserve Bank of San Francisco or of the Board of Governors of the Federal Reserve System. This publication is edited by Anita Todd and Karen Barnes. Permission to reprint portions of articles or whole articles must be obtained in writing. Please send editorial comments and requests for reprint permission to research.library@sf.frb.org