
When products disappear from the market with no substitutes from the same manufacturer, they may have been replaced by cheaper or better products from a different manufacturer. Official measurements typically approximate price changes from such creative destruction using price changes for products that were not replaced. This can lead to overstating inflation and, in turn, understating economic growth. A recent estimate suggests that around 0.6 percentage point of growth is missed per year. The bias has not increased over time, however, so it does not explain the slowdown in productivity growth.
A gloomy view of the economy suggests that the measured slowdown in U.S. productivity growth since 2004 reflects a true slowdown in innovation and productivity gains. From 1995 to 2004 businesses boosted the average growth rate to nearly 3.75 percentage points annually by adopting information technology (IT) to make their operations more efficient (Byrne, Fernald, and Reinsdorf 2017). Since then, measured productivity growth has slowed to around 1.75 percentage points per year. Perhaps it has become more difficult to achieve the same rapid rate of improvement as in the past. But has productivity growth truly slowed down?
To answer this question, one needs to keep in mind that measured productivity growth is designed to capture growth in market activities. Thus, it may not fully capture the growth in people’s economic welfare because it misses out on important dimensions such as increasing lifespans and rising home production. So, even if the measurement is correct, a slowdown in measured productivity growth does not necessarily reflect a slowdown in welfare growth. For example, many recent IT innovations involve nonmarket activities such as time spent on social media and time saved from shopping online. Although these areas may improve welfare, they have not historically been covered by productivity measurements, so ignoring them cannot directly contribute to any growing understatement of market-sector growth.
This Economic Letter focuses on measuring growth from innovation in parts of the economy that have traditionally been within the scope of productivity measurement. Past research has found that measurement problems in the IT sector associated with market production and offshoring activities cannot explain much of the growth slowdown (see Aghion et al. 2017 for references). In this Letter, we consider whether errors in measuring innovation outside the IT sector can explain the substantial slowdown.
Quality adjustment in inflation measurement
As a first step toward measuring growth, the Bureau of Economic Analysis adds up the dollar value of goods and services sold, which equals “nominal output.” However, due to inflation—a general increase in overall price levels—one dollar today does not have the same purchasing power as one dollar three decades ago. This means the agencies measuring these data need to subtract the inflation rate from growth in nominal output to arrive at growth in real output. Hence, a 1% overstatement of inflation translates into a 1% understatement of measured real output growth. This translates into a 1% understatement of productivity growth as well, because productivity growth is the difference between real output growth and the growth in capital and labor inputs used in production.
The natural follow-up question then is, how is inflation measured? Inflation is meant to capture the change in the purchasing power of a dollar. Suppose between 2016 and 2017 the price for the exact same car increases by 3%. Then the inflation rate for that car is obviously 3%. However, car producers typically update features of their models from one year to the next. So a 2017 model may have better fuel efficiency than the 2016 model. In this event, the true inflation rate is lower than the 3% change in nominal price because the quality of the car has improved. The measurement agencies need to take this quality improvement out of the 3% to arrive at what is called a “quality-adjusted price change.” Inflation for the car is mismeasured if too much or too little quality adjustment is taken out of nominal price changes by the Bureau of Labor Statistics (BLS), which calculates inflation rates in the United States.
Bias from missing out on quality improvements by the same producer was one source of potential mismeasurement emphasized by the famous Boskin Commission (1996). The Boskin Commission was a committee appointed by the U.S. Senate to assess the reliability of inflation data. In addition to bias from understating quality improvements, the Commission pointed out biases from not capturing the benefits of new product varieties and from not properly accounting for how consumers switch to cheaper substitutes when the price of a product increases.
Products such as electronics and apparel are particularly affected because their quality changes frequently. The BLS uses several methods to adjust for these changes. These methods, and the Boskin Commission’s critique of them, focus on updates made by existing producers, or “incumbents,” to their own products. But what happens when a producer is replaced by a different producer—for example, when a new restaurant forces a nearby restaurant out of business because customers prefer their menu?
When a product disappears without being replaced by a new version from the same producer in the same location, the BLS typically fills in or “imputes” the missing price and then starts tracking a new item. In particular, the BLS imputes inflation for the disappearing item to be the same as inflation for similar products that remain on the market. The BLS resorts to such imputation roughly twice as often as it directly estimates quality changes (Aghion et al. 2017).
Missing growth due to imputation
In doing such imputation, the BLS assumes the inflation rate is the same for changeovers from old to new producers as it is for all surviving items. This may not be an accurate assumption of the true values. Research since Schumpeter (1942) highlights growth driven by so-called creative destruction. Under creative destruction, new producers replace existing producers precisely because they introduce a product with a lower quality-adjusted price. The items that survive are those that do not experience creative destruction. Most of these surviving items have not been updated at all, according to the BLS. Hence, by using the inflation of surviving products to approximate the inflation rate of products that disappear, the BLS could be overstating the inflation rate of the disappearing products.
To quantify the extent of missing growth caused by imputation bias, in Aghion et al. (2017), we and our colleagues analyze the market share of incumbent producers—that is, the sales of incumbents relative to total sales. When two products have the same quality, the producer who sells at a lower price will sell more and hence have a higher market share. More specifically, a product whose price relative to its quality—quality-adjusted price—is lower will have a higher market share. By this logic, the market share of incumbent products shrinks when their quality-adjusted prices increase relative to products made by new market entrants. Imputation assumes that these inflation rates are the same, so that incumbent market shares should be stable. If instead incumbent market shares tend to shrink over time, then this would be a sign that imputation overstates the inflation rate for creatively destroyed products, leading to an understatement of growth. The more incumbent market shares shrink, the larger the bias.
Figure 1 displays our estimates of missing growth due to imputation, based on the employment shares of incumbent establishments in the U.S. Census (Aghion et al. 2017). An establishment is a given site, such as a Wal-Mart outlet or a GM auto factory. Ideally, one would want to measure an establishment’s market share using sales data. Unfortunately, sales data are not available for all establishments in the economy. However, since producers need to increase inputs to sell more, they tend to use more inputs when their market share rises. We therefore use employment and payroll shares to proxy for the sales share. Figure 1 also shows the true growth calculated by adding this source of missing growth to BLS measured productivity growth. For measured growth, we use BLS multifactor productivity in labor-augmenting units including the contribution of research and development.
Figure 1
Missing growth and true growth
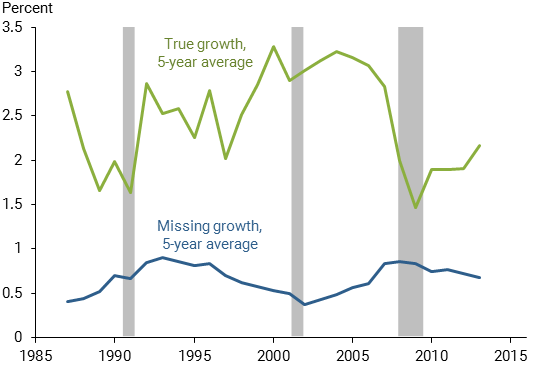
Note: True growth is the sum of missing growth and BLS multifactor
productivity series in labor-augmenting units.
There are two key takeaways from Figure 1. First, we estimate missing growth to be about 0.6% per year on average from 1983 to 2013. By this estimate, roughly one-fourth of true growth is missed. Second, while there are fluctuations, no clear trends emerge for missing growth. In particular, missing growth has not systematically increased over time, as reflected in the true growth series. There is a substantial decline in productivity growth post-2004 even after adjusting for missing growth.
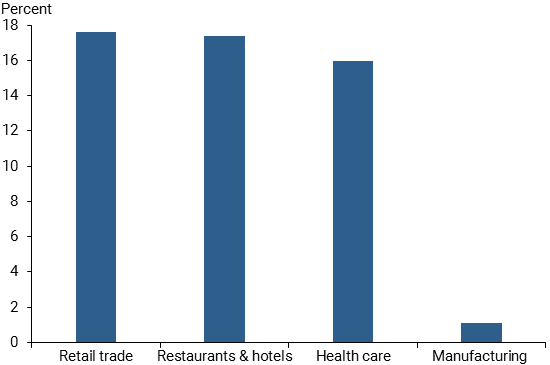
Our approach in Aghion et al. (2017) can drill down to find missing growth in individual sectors. Figure 2 displays the three sectors that contributed the most to missing growth: retailers, restaurants and hotels, and health care. Each of these contributes about one-sixth of total missing growth. In contrast, there was little missing growth in manufacturing, which has been the focus of so much attention. Over our sample period, we tend to find more missing growth in sectors with higher rates of entry of new establishments. For retail, our missing growth could reflect unmeasured productivity gains brought by new outlets—so-called outlet-bias. Our numbers suggest that outlet bias may be much larger than previous estimates from the Boskin Commission.
Figure 2
Contributions to missing growth by selected sectors
Conclusion
This Letter considers whether inflation is overstated when items disappear and are replaced by cheaper or better items. If so, official government statistics could be missing some growth. If this problem had gotten worse over time, it could help explain the slowdown in measured productivity growth since 2004. However, we find that missing growth has been relatively constant over time, so true productivity growth has slowed, even after accounting for this bias. Although the bias does not explain much of the sharp decline in productivity growth, its magnitude is economically significant—nearly 0.6% per year on average, or about one-fourth of true growth.
Measuring real growth properly is useful for addressing a host of questions. For example, existing studies use measured inflation to calculate the real income of children relative to their parents. Chetty et al. (2017) find that 50% of children born in 1984 achieved higher incomes than their parents at age 30. Adjusting for missing growth would raise the real income of children about 17% relative to their parents, increasing the fraction of those who do better than their parents by a meaningful amount. Thus, to the extent that inflation is overstated due to imputed values, a larger fraction of children appear to be better off economically than their parents. This improvement in economic welfare can shine a bit more positive light on current conditions, despite the gloom of slower productivity growth.
Pete Klenow is a professor of economics at Stanford University and a visiting scholar in the Economic Research Department of the Federal Reserve Bank of San Francisco.
Huiyu Li is an economist in the Economic Research Department of the Federal Reserve Bank of San Francisco.
References
Aghion, Philippe, Antonin Bergeaud, Timo Boppart, Peter J. Klenow, and Huiyu Li. 2017. “Missing Growth from Creative Destruction.” FRBSF San Francisco Working Paper 2017-04.
Boskin, Michael, Robert J. Gordon, Ellen Dullberger, Zvi Grilliches, and Dale Jorgenson. 1996. “Toward a More Accurate Measure of the Cost of Living.” Final report of the Senate Finance Committee from the Advisory Commission to Study the Consumer Price Index.
Byrne, David, John G. Fernald, and Marshall Reinsdorf. 2017. “Does Growing Mismeasurement Explain Disappointing Growth?” FRBSF Economic Letter 2017-04 (February 13), Figure 1.
Chetty, Raj, David Grusky, Maximilian Hell, Nathaniel Hendren, Robert Manduca, and Jimmy Narang. 2017. “The Fading American Dream: Trends in Absolute Income Mobility since 1940.” Science.
Schumpeter, Joseph. 1942. Capitalism, Socialism, and Democracy. New York: Harper & Bros.
Opinions expressed in FRBSF Economic Letter do not necessarily reflect the views of the management of the Federal Reserve Bank of San Francisco or of the Board of Governors of the Federal Reserve System. This publication is edited by Anita Todd and Karen Barnes. Permission to reprint portions of articles or whole articles must be obtained in writing. Please send editorial comments and requests for reprint permission to research.library@sf.frb.org