
The U.S. economy is facing a future of slow growth, mainly because the labor force is expanding less rapidly. However, there are ways to improve. Given the important role education plays in labor force participation, employment, and wages, investing in education across diverse groups offers an important opportunity to raise the speed limit for economic growth. The following is adapted from a speech by the executive vice president and director of research of the Federal Reserve Bank of San Francisco to Lambda Alpha International Land Economics Society in Phoenix, AZ, on March 29.
It’s wonderful to be here in such beautiful surroundings. I always enjoy coming to Phoenix; the person who inspired me to pursue a career in economics lives here, and he’s also the reason I’m standing in front of you today. He said it’s important to do economics, but it’s even more important to share economics to advance a productive and vibrant society, and that’s what I hope to do with this talk.
Today I’m going to talk about economic growth past, present, and future and shed some light on the factors holding back the pace at which we are likely to expand going forward. I’m also going to highlight some ways in which we can alter that path and achieve greater prosperity.
Current economic conditions
Before I consider the future or even the past, I want to give you an overview of the economy’s current performance, and it’s good news: We’re in the third (soon to be the second) longest expansion in history. The labor market is booming, consumer and business spending are solid, and all the other key economic indicators are flashing green. An added boost is coming from a number of tailwinds, including supportive financial conditions, strong global growth, and the recent fiscal stimulus.
The national picture is reflected here in Arizona. If the airport is any indication things are good, especially in Phoenix. And as a whole, Arizona is adding jobs at a rapid clip, unemployment is low, and the housing market, so negatively affected in the aftermath of the financial crisis, is getting its legs back.
So overall, the U.S. economy is in good shape and the prospects are bright. We expect ongoing solid growth in coming years, with further tightening in labor markets and a gradual return of inflation to 2%. With the economy doing so well, it’s a good time to ask, what is the sustainable speed limit going forward?
Average GDP growth over the 60 years preceding the Great Recession, was just under 3.5%. But if we look ahead, economists forecast numbers closer to 2%. The economic pie is going to grow at nearly half the speed we’re used to. In the remainder of my time, I want to take a step back and talk about why growth is forecast to be slower than what we’ve seen in previous expansions and what we might do about it. The data reveal answers that may be surprising, but nonetheless they are ones we must contend with if we are to create a more prosperous future.
Drags on future growth
So how did we go from an economy with a speed limit of 3.5% to one bridled by a number closer to 2%? Many potential candidates make the news: excessive regulation, taxes, lack of competitiveness, etc. And all of those play some role in shaping our future. But in the end, none of them can really account for the dramatic change in prospects we see. To explain that, we need to look at the fundamental drivers of economic growth: growth in productivity and the labor force.
And here, the data tell the story. Figure 1 shows the contributions to GDP growth from 1950 to 2025. The data come from the Congressional Budget Office (2017), the organization responsible for supporting policymakers in budgeting. The dark blue sections of the bars represent potential labor force growth and the light blue sections represent potential productivity growth. What this shows us is that productivity growth has varied over time, but since the 1980s has contributed on average about 1.5% to growth and is forecast to do the same going forward.
Figure 1
Slow labor force growth hinders GDP growth
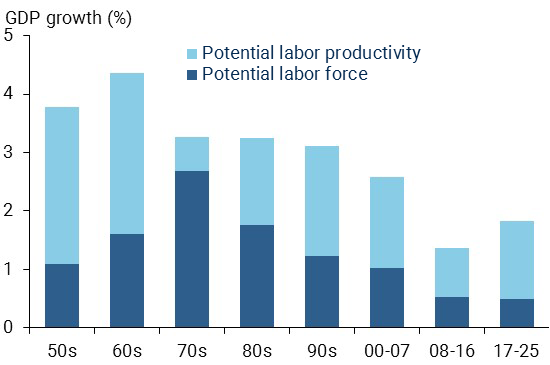
Source: Congressional Budget Office; author’s estimate for potential labor productivity, 2017–2025.
The pattern for labor force growth is quite a bit different. In the 1970s, labor force growth alone contributed 2.7 percentage points to GDP growth, meaning that even if productivity growth had been zero, the economy would have expanded at 2.7%, slightly faster than the pace of our current expansion. Since that peak, labor force growth has come down substantially. As the forecast for 2025 shows, labor force growth is expected to remain stuck at 0.5% for the next decade. This means that, absent a surge in productivity, slow growth in the labor force will be a restraining factor on the U.S. economic speed limit.
Where have the American workers gone?
Where have all the workers gone? Demographics play a big role in labor force growth, and at the moment many baby boomers are heading off for retirement. At the same time, the fertility rate has slowed: Put simply, people are having fewer babies. Together, these two factors explain a large share of the changes in labor force growth displayed in the graph. Notably, the United States is not unique in these respects. Population aging is a global phenomenon, and many industrialized nations have seen their birth rates fall.
But these trends don’t explain everything. We’ve also seen a drop in the level of labor force participation among workers in their prime employment years, a pattern that does look quite a bit different from other countries.
Labor force participation in the United States for prime-age workers reached a peak in the late 1990s and then took a steep dive in the 2001 recession (Figure 2). In the 2007 recession, it took an even steeper tumble, reaching a low point in 2015, nearly eight years after the initial downturn. While we have seen improvements since, they have been modest. So today, the share of men and women in their prime working years who are employed or actively searching for a job is far lower than it was in the 1990s.
Figure 2
U.S. labor force participation rate declining
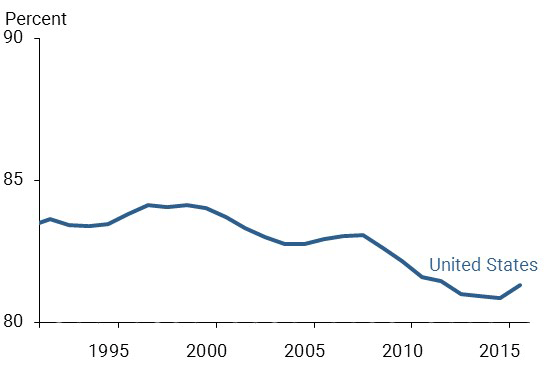
Source: OECD: rate for ages 25–54.
What’s really interesting in these data is that, unlike the trends for retirement and fertility, this one is unique to the United States. We don’t see the same thing happening in other advanced economies (Figure 3).
Figure 3
U.S. labor participation diverging from international trends
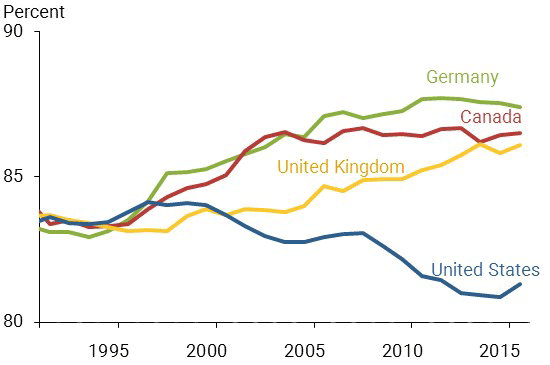
Source: OECD: rates for ages 25–54.
This chart compares the percentage of prime-age workers in the labor force in Germany, Canada, the United Kingdom, and the United States. In these other advanced economies, labor force participation of prime-age workers has increased overall and now stands far—several percentage points—above the rates observed in the United States.
Which raises the question—why aren’t American workers working?
The answer is not simple, and numerous factors have been offered to explain the decline in labor force participation. Research by a colleague from the San Francisco Fed and others suggests that some of the drop owes to wealthier families choosing to have only one person engaging in the paid labor market (Hall and Petrosky-Nadeau 2016). And I emphasize paid here, since the other adult is often staying at home to care for house or children, invest in the community, or pursue education. Whatever the alternative activity, some of the lost labor market participation seems related to having the financial ability to make work–life balance choices.
Another factor behind the decline is ongoing job polarization that favors workers at the high and low ends of the skill distribution but not those in the middle. I know for myself, I never call a travel agent anymore. With a few taps and swipes on my phone, I can book a trip to almost anywhere in the world in seconds. But it goes far beyond that: Our economy is automating thousands of jobs in the middle-skill range, from call center workers, to paralegals, to grocery checkers.
A growing body of research finds that these pressures on middle-skilled jobs leave a big swath of workers on the sidelines, wanting work but not having the skills to keep pace with the ever-changing economy (see Abraham and Kearney 2018; Autor, Katz, and Kearney 2006; and Autor 2010).
The final and perhaps most critical issue I want to highlight also relates to skills: We’re not adequately preparing a large fraction of our young people for the jobs of the future. Like in most advanced economies, job creation in the United States is being tilted toward jobs that require a college degree (OECD 2017). Even if high school-educated workers can find jobs today, their future job security is in jeopardy. Indeed by 2020, for the first time in our history, more jobs will require a bachelor’s degree than a high school diploma (Carnevale, Smith, and Strohl 2013).
These statistics contrast with the trends for college completion. Although the share of young people with four-year college degrees is rising, in 2016 only 37% of 25- to 29-year-olds had a college diploma (Snyder, de Brey, and Dillow 2018). This falls short of the progress in many of our international competitors (OECD 2018), but also means that many of our young people are underprepared for the jobs in our economy.
So where should we focus our efforts when it comes to getting more young people into college? One place to start is in working to equalize educational attainment across students of different races and ethnicities.
As Figure 4 shows, the lion’s share of young Americans of Asian descent complete a four-year college degree. A smaller but still sizable share of white Americans, about 45%, also get a degree. The numbers drop off dramatically from there. Less than 25% of black and Hispanic young people go on to complete a college diploma (Snyder, de Brey, and Dillow 2018). This is troubling from an equal opportunities perspective, but it’s also incredibly bad news for the economy, both today and certainly in the future. Our population is growing increasingly diverse: By 2024, just short of 40% of our labor force will be ethnicities other than white and Asian (Toossi 2015).
Figure 4
Bachelor’s degrees among Americans ages 25–29
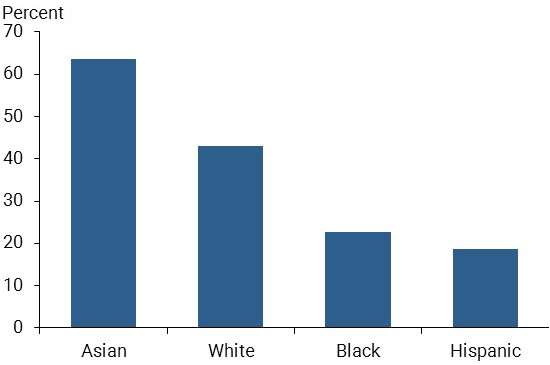
Source: 2016 data from National Center for Education Statistics (2018).
Given the important role that education plays in labor force participation, employment, and wages, equalizing the educational attainment across these groups has big benefits for the economy.
Faster growth through human capital
The really good news is that education is generally a win–win, beneficial to individuals and to taxpayers. We know that those with a college degree are much more likely to become top earners during their career, regardless of their financial background (Daly 2012; Daly and Bengali 2013, 2014; and Daly and Cao 2015). They have lower unemployment rates, and they’re less likely to become unemployed during a recession. And while there’s no doubt the cost of college is a strain for many, the average time it takes to recoup that cost is 10 years (Abel and Deitz 2014). This means that, relative to many other investments, education pencils out, even if graduates don’t go on to earn top salaries.
For taxpayers the math is even more straightforward. A detailed study by the OECD shows that college is a great investment for taxpayers (OECD 2017). The costs paid to educate are more than covered by increased productivity, longer and more stable work lives, and higher tax revenues from graduates.
In the parlance of economics, education is incentive compatible, good for everyone involved.
Conclusion
To wrap up, the U.S. is facing a future of slow growth, a “new normal.” But it doesn’t have to be that way. The United States has considerable room to run in actively engaging working age people in the labor market. Investing on this front is a lever we can pull that changes the fundamentals of economic growth and gives us an opportunity to raise the speed limit.
Mary C. Daly is executive vice president and Director of Research in the Economic Research Department of the Federal Reserve Bank of San Francisco.
References
Abel, Jaison R., and Richard Deitz. 2014. “Do the Benefits of College Still Outweigh the Costs?” Current Issues in Economics and Finance 20(3), Federal Reserve Bank of New York.
Abraham, Katharine G., and Melissa S. Kearney. 2018. “Explaining the Decline in the U.S. Employment-to-Population Ratio: A Review of the Evidence.” NBER Working Paper 24333.
Autor, David. 2010. The Polarization of Job Opportunities in the U.S. Labor Market: Implications for Employment and Earnings. Center for American Progress and The Hamilton Project.
Autor, David, H., Lawrence F. Katz, and Melissa S. Kearney. 2006. “The Polarization of the U.S. Labor Market.” American Economic Review Papers and Proceedings 96(2), pp. 189–194.
Carnevale, Anthony P., Nicole Smith, and Jeff Strohl. 2013. Recovery: Job Growth and Education Requirements through 2020. Center on Education and the Workforce, Georgetown Public Policy Institute.
Congressional Budget Office. 2017. An Update to the Budget and Economic Outlook: 2017 to 2027. June 29.
Daly, Mary C. 2012. “Economics in Person: Economic Mobility in the United States.” FRB San Francisco, Education video.
Daly, Mary C., and Leila Bengali. 2013. “U.S. Economic Mobility: The Dream and the Data.” FRBSF Economic Letter 2013-06 (March 4).
Daly, Mary C., and Leila Bengali. 2014. “Is It Still Worth Going to College?” FRBSF Economic Letter 2014-13 (May 5).
Daly, Mary C., and Yifan Cao. 2015. “Does College Pay?” Does College Matter? Federal Reserve Bank of San Francisco 2014 Annual Report.
Hall, Robert, and Nicolas Petrosky-Nadeau. 2016. “Changes in Labor Participation and Household Income.” FRBSF Economic Letter 2016-02 (February 1).
Organisation for Economic Co-operation and Development (OECD). 2017. Education at a Glance 2017: OECD Indicators. Paris: OECD Publishing. See also “Key Indicators: Education at a Glance” slides.
OECD. 2018. “Population with Tertiary Education (Indicator).” Chart, OECD Data website, accessed March 28, 2018.
Pew Research Center. 2015. “Modern Immigration Wave Brings 59 Million to U.S., Driving Population Growth and Change Through 2065: Views of Immigration’s Impact on U.S. Society Mixed.” Washington, DC: September.
Snyder, Thomas D., Cristobal de Brey, and Sally A. Dillow. 2018. Digest of Education Statistics 2016. National Center for Education Statistics, NCES 2017-094.
Toossi, Mitra. 2015. “Labor Force Projections to 2024: The Labor Force Is Growing, but Slowly.” Monthly Labor Review (December), U.S. Bureau of Labor Statistics.
Opinions expressed in FRBSF Economic Letter do not necessarily reflect the views of the management of the Federal Reserve Bank of San Francisco or of the Board of Governors of the Federal Reserve System. This publication is edited by Anita Todd and Karen Barnes. Permission to reprint portions of articles or whole articles must be obtained in writing. Please send editorial comments and requests for reprint permission to research.library@sf.frb.org