
Studies that seek to forecast stock price movements often consider measures of market sentiment or stock return momentum as predictors. Recent research shows that a multiplicative combination of sentiment and momentum can help predict the return on the Standard & Poor’s 500 stock index over the next month. This predictive power derives mainly from periods when sentiment has been declining over the past year and recent return momentum is negative—periods that coincide with an increase in investor attention to the stock market as measured by a Google search volume index.
The idea that market sentiment or momentum may drive stock price movements has a long history. Keynes (1936, p. 156) likened the stock market to a “beauty contest” where participants devote their efforts not to judging the underlying concept of beauty, but instead to “anticipating what average opinion expects the average opinion to be.” Shiller (2005) describes a simple and intuitive feedback model of stock price movements. If prices start to rise, the success of some investors can attract public attention that fuels enthusiasm for the market. New investors enter the market and help bid up prices. Rising prices beget expectations of further increases to the point where “irrational exuberance” may cause prices to exceed levels that can be justified by fundamentals. But if prices begin to sag, pessimism can take hold, causing some investors to exit the market. Falling prices beget expectations of further decreases, and so on, until prices finally reach a bottom. More recently, Shiller (2017) argues that investors’ optimistic or pessimistic beliefs about the stock market are similar to fads that can spread through the popular culture like an infectious disease.
Motivated by these ideas, this Economic Letter summarizes recent research by Lansing, LeRoy, and Ma (2018) that examines whether measures of sentiment and stock return momentum are helpful for predicting future stock returns. We confirm the finding that, while sentiment and momentum individually are not helpful for predicting near-term stock returns, a multiplicative combination of the two is a robust predictor of the percentage change, that is, the return on the Standard & Poor’s (S&P) 500 stock index over the next month. Interestingly, the sentiment-momentum variable is positively correlated with fluctuations in Google searches for the term “stock market,” which tend to increase sharply when stock prices and consumer sentiment are both declining. While neither the sentiment-momentum variable nor the Google search volume index represent a direct measure of investors’ beliefs, both appear to serve as a useful proxy for investors’ outlook for stocks.
Sorting out correlation versus causation
Figure 1 shows the 12-month change in the University of Michigan’s consumer sentiment index together with the 12-month percentage change in the S&P 500 stock index. Measuring how much each series changes over a 12-month period makes it easier to see a pattern of co-movement between the two data series. The correlation coefficient that measures this co-movement is strongly positive. But since correlation is not the same as causation, we cannot conclude from this evidence that movements in sentiment drive stock returns. The reverse could be true, that stock returns drive movements in sentiment.
Figure 1
Stocks and sentiment relationship and Google search index
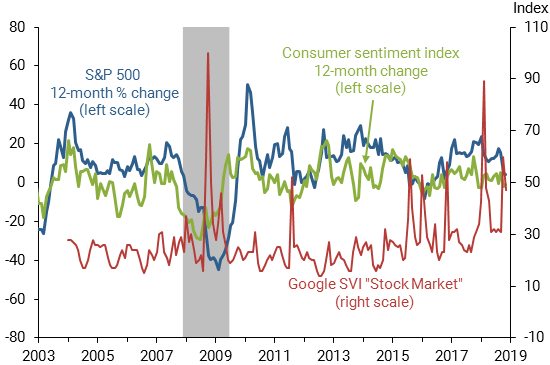
Source: University of Michigan, S&P Dow Jones Indices LLC, and Google.
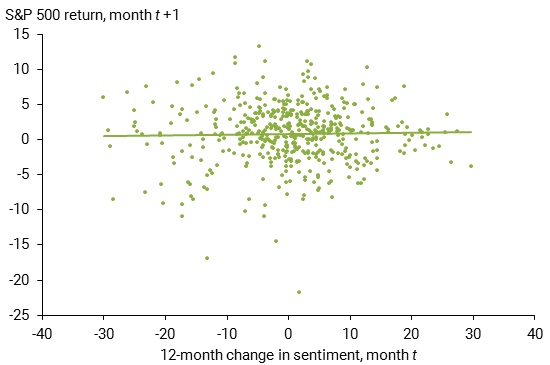
To help sort out the direction of causation between stock returns and sentiment, it’s useful to plot the current month’s value of one variable against the next month’s value of the other variable. Figure 2 shows the 12-month change in consumer sentiment for a given month versus the subsequent return on the S&P 500 stock index over the next month. The return is given by the 1-month percentage change in the S&P 500 index computed using end-of-month closing values. The sample period runs from February 1979 through November 2018. The fitted regression line showing the relationship between the two variables is nearly flat, indicating that the change in consumer sentiment does not help to predict the stock return over the next month. We find similar results if we use the 1-month change in consumer sentiment, rather than the 12-month change, to predict the stock return over the next month. These results are consistent with the findings of other empirical studies (Fisher and Statman 2003, Brown and Cliff 2004).
Figure 2
Sentiment alone does not predict stock returns
We can also consider the reverse causation by plotting the return on the S&P 500 stock index for a given month versus the subsequent change in consumer sentiment over the next month. Although not shown, the fitted relationship in this case is positive and statistically significant, suggesting that causation runs from stock returns to sentiment, not vice versa.
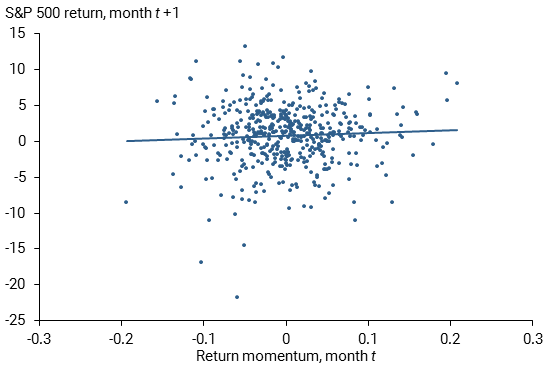
We can also examine whether recent stock return momentum helps predict the stock return over the next month. Momentum is measured by the 1-month change in the monthly return on the S&P 500 stock index.
Figure 3 shows the return momentum for a given month versus the subsequent return on the S&P 500 stock index over the next month. Similar to Figure 2, the regression line is nearly flat, indicating that recent return momentum does not help predict the stock return over the next month.
Figure 3
Momentum alone does not predict stock returns
Can sentiment and momentum theories be salvaged?
Taken together, the evidence in Figures 2 and 3 would appear to refute theories that ascribe a causal role to sentiment or momentum in driving stock returns. But these simple scatter plots may overlook a more complex relationship among the variables. In a recent comprehensive study of stock return predictability, Gu, Kelly, and Xiu (2018) find that allowing for potentially complex, nonlinear interactions among candidate predictor variables can often improve forecasting performance. Motivated by this finding, Lansing et al. (2018) construct a predictor variable that multiplies the 12-month change in consumer sentiment by a metric of recent stock return momentum. They find that the sentiment-momentum variable is a robust predictor of 1-month-ahead stock returns. Specifically, the estimated regression coefficient on the sentiment-momentum variable remains stable and statistically significant over various sample periods. Moreover, including the sentiment-momentum variable consistently helps predict stock returns in out-of-sample forecasting tests.
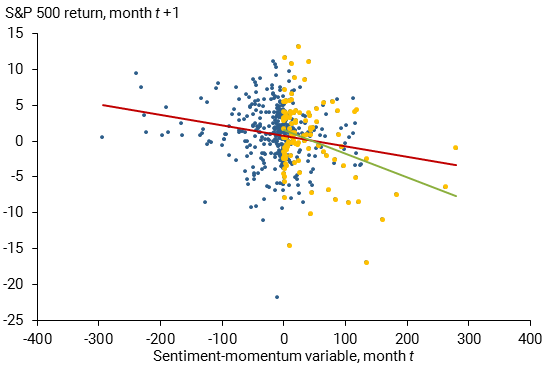
Following the methodology of Lansing et al. (2018), Figure 4 plots our version of the sentiment-momentum variable in a given month versus the subsequent return on the S&P 500 stock index over the next month. The fitted relationship using the full sample of data (red regression line) is negative and statistically significant, indicating that a multiplicative combination of sentiment and momentum can indeed help to predict the stock return over the next month. Lansing et al. (2018) show that this basic finding is robust to including other predictor variables, namely, the S&P 500 price-dividend ratio, measures of stock return volatility, and the 12-month change in the federal funds rate. These other predictor variables are included to control for changes in fundamental risk factors that could shift investors’ expected return from owning stocks. A shift in the expected return could, in turn, influence the subsequent actual return from owning stocks. Indeed, including the other predictor variables helps forecast the stock return over the next month, while the estimated regression coefficient on the sentiment-momentum variable remains statistically significant.
Figure 4
Sentiment x momentum can predict stock returns
When are sentiment and momentum useful predictors?
In order to identify which particular interaction drives these findings, Figure 4 shows an alternative fitted relationship (green regression line) that only uses data for periods when sentiment has been declining over the past 12 months and return momentum is negative (plotted as yellow dots). Relative to the full sample results, the alternative fitted relationship is more negative and exhibits a higher degree of statistical significance. Repeating the exercise for other possible data classifications—for example, periods when sentiment has been rising over the past 12 months and return momentum is positive—delivers fitted relationships that are consistently negative but not statistically significant. These results tell us that the predictive power of the sentiment-momentum variable derives mainly from periods when sentiment has been declining and return momentum is negative, which taken together forecast a negative contribution to the stock return over the next month.
What type of investor behavior could account for the stronger predictive power of the sentiment-momentum variable in this one particular classification of the data? In exploring this question, Lansing et al. (2018) show that the sentiment-momentum variable is positively correlated with monthly changes in the volume of Google searches for the term “stock market.” This pattern suggests that the sentiment-momentum variable may help predict stock returns because it captures shifts in investor attention to recent stock price movements. These movements, in turn, could influence investors’ subsequent decisions to buy or sell stocks, which could put upward or downward pressure on stock prices.
When do investors pay more attention to the stock market? To help answer this question, Figure 1 also depicts the monthly Google Search Volume Index (SVI) for the term “stock market,” which is available beginning in January 2004. The SVI spikes upward when stock prices and consumer sentiment are both declining. This pattern is particularly evident during the height of the global financial crisis in October 2008 when the SVI reached its all-time high. Another example is the recent month of October 2018 when the S&P 500 stock index declined about 7%, the 12-month change in the consumer sentiment index turned negative, and the Google SVI for “stock market” spiked upwards to its third highest level ever. Indeed, the correlation coefficient between the SVI for “stock market” and the SVI for “stock market crash” is 0.83. Given these patterns, it would appear that the sentiment-momentum variable helps predict episodes of below-average stock returns because it serves as a type of investor pessimism indicator.
Conclusion
A vast literature in economics and finance has explored whether movements in stock prices can be predicted using observable data. Measures of sentiment and stock return momentum are often included as possible predictors. Lansing, LeRoy, and Ma (2018) find that while consumer sentiment and return momentum are individually not helpful for predicting stock returns, a multiplicative combination of sentiment and momentum can help predict the S&P 500 stock return over the next month. The predictive power of the sentiment-momentum variable derives mainly from periods when sentiment has been declining over the past year and recent return momentum is negative. These are periods when investors pay increased attention to the stock market. The resulting pessimism appears to motivate many investors to sell stocks, putting further downward pressure on stock prices, which contributes to a below-average stock return over the next month.
Kevin J. Lansing is a research advisor in the Economic Research Department of the Federal Reserve Bank of San Francisco.
Michael Tubbs is a research associate in the Economic Research Department of the Federal Reserve Bank of San Francisco.
References
Brown, Gregory W., and Michael T. Cliff. 2004. “Investor Sentiment and the Near-Term Stock Market.” Journal of Empirical Finance 11(1), pp. 1–27.
Fisher, Kenneth L., and Meir Statman. 2003. “Consumer Confidence and Stock Returns.” Journal of Portfolio Management 30(1), pp. 115–127.
Gu, Shihao, Bryan T. Kelly, and Dacheng Xiu. 2018. “Empirical Asset Pricing via Machine Learning.” University of Chicago-Booth Research Paper 18-04.
Keynes, John M. 1936. The General Theory of Employment, Interest and Money. London: Macmillian.
Lansing, Kevin J., Stephen F. LeRoy, and Jun Ma. 2018. “Examining the Sources of Excess Return Predictability: Stochastic Volatility or Market Inefficiency?” FRBSF Working Paper 2018-14.
Shiller, Robert J. 2005. Irrational Exuberance, 2nd edition. Princeton, NJ: Princeton University Press.
Shiller, Robert J. 2017. “Narrative Economics.” American Economic Review 107(4), pp. 967–1,004.
Opinions expressed in FRBSF Economic Letter do not necessarily reflect the views of the management of the Federal Reserve Bank of San Francisco or of the Board of Governors of the Federal Reserve System. This publication is edited by Anita Todd and Karen Barnes. Permission to reprint portions of articles or whole articles must be obtained in writing. Please send editorial comments and requests for reprint permission to research.library@sf.frb.org