
Gross domestic income and gross domestic product—GDI and GDP—measure aggregate economic activity using income and expenditure data, respectively. Discrepancies between the initial estimates of quarterly growth rates for these two measures appear to have some predictive power for subsequent GDP revisions. However, this power has weakened considerably since 2011. Similarly, the first revision to GDP growth has less predictive power in forecasting subsequent revisions since 2011. One possible explanation is that evolving data collection and estimation methods have helped improve initial GDP and GDI estimates.
Gross domestic product (GDP) and gross domestic income (GDI) are two measures of economic activity that should be identical in theory but often differ significantly in practice. The more familiar GDP is measured using expenditure data, while GDI is measured using income data. The fact that the quarterly growth rates of these two may differ significantly creates complications for policymakers who seek to gauge the state of the economy in real time. For example, the Bureau of Economic Analysis (BEA) estimated that economic activity in the fourth quarter of 2017 expanded at an annual rate of 2.9% as measured by GDP versus only 1.0% as measured by GDI. Using either of these measures independently could support different views about the underlying strength of the economy and, therefore, result in potentially different policy responses. Assessing economic conditions is further complicated by the fact that GDP and GDI estimates are repeatedly revised in subsequent months and years as new source data become available. Revised estimates of GDP or GDI are considered more accurate readings of the true underlying level of economic activity. Consequently, any information that could help predict the direction of these subsequent revisions may be a useful tool for policymakers.
This Economic Letter examines whether the discrepancy between the initial GDI and GDP growth data contains any useful information about subsequent revisions to quarterly GDP growth. Revisiting the analysis of Nalewaik (2011), we find a positive and statistically significant relationship between the initially reported GDI-GDP growth discrepancy and the cumulative revision that takes place in arriving at the latest-vintage estimate of quarterly GDP growth. The relationship was reasonably strong through 2011 but has since weakened considerably. We also examine whether the first revision to GDP growth helps in forecasting subsequent revisions. Through 2011, we find that an upward (downward) first revision to quarterly GDP growth is typically associated with an upward (downward) cumulative revision when arriving at the latest-vintage estimate of quarterly GDP growth. But again, any useful signal contained in the first revision to quarterly GDP growth has essentially disappeared in data since 2011.
Two measures of economic activity
The BEA releases quarterly estimates of two measures of economic activity, GDP and GDI. The first release of quarterly GDP, also called the “advance” release, occurs a month after the close of a given quarter. The first GDI release is delayed because data on two of its major components—corporate profits and net income from the rest of the world—take longer to collect. This initial GDI report for a quarter comes out two months after the close of that quarter at the same time as the second or “preliminary” GDP estimate. For the fourth quarter of a year only, the first release of GDI is further delayed by two months, such that it coincides with the third or “final” estimate of GDP for that quarter. Both GDP and GDI are subsequently revised in comprehensive annual revisions. The annual revisions typically change data over the previous three years, with every fifth annual revision going back even further (BEA 2012).
Conceptually, GDP and GDI are two sides of the same coin. GDP is calculated as total expenditures on final goods and services while GDI is calculated as total income, that is, the sum of wages, profits, and interest payments. A simple example is a haircut. The expenditure by the customer is exactly the income for the hair salon. By either measure, this transaction should contribute the same amount to total economic activity. In reality, however, GDP and GDI can differ substantially because the two measures employ different data sources and estimation methods.
Researchers have debated for years on the best way to construct an ideal measure of economic activity. Some favor a composite measure that is constructed as a weighted-average of GDP and GDI (Greenaway-McGrevy 2011 and Council of Economic Advisers 2015). Indeed, since July 2015 the BEA has included a simple average of the growth rates of GDP and GDI in its monthly release of national income and product account estimates. Liu, Speigel, and Tallman (2018) evaluated the forecasting performance of GDP growth versus GDI growth in predicting a broad-based statistical indicator of real economic activity, namely the Chicago Fed National Activity Index (CFNAI). They find that GDP growth tends to outperform GDI growth in forecasting CFNAI since 1984.
Initially reported GDI-GDP growth discrepancy
We explore whether policymakers can use the relationship between the initial GDI and GDP estimates and subsequent GDP revisions to improve forecasts. Specifically, we use a simple regression model to assess whether the initially reported GDI-GDP growth discrepancy provides any signal about subsequent revisions to GDP growth. The dependent variable in the regression is the difference between the latest-vintage estimate and the first estimate of a specific quarter’s GDP growth. The latest-vintage estimate for any given quarter may include numerous comprehensive revisions cumulated over several years. We then regress the dependent variable on a constant and the initially reported GDI-GDP growth discrepancy. The initially reported growth discrepancy is the difference between the earliest available estimates of both GDI and GDP growth for a given quarter. This discrepancy can be computed upon release of the first estimate of GDI. Our data sample runs from the beginning of 2004, the first year the BEA published sequential estimates of real GDI growth, to the third quarter of 2017. We divide this into two subsamples, the first running from the first quarter of 2004 to the fourth quarter of 2011 and the second running from the first quarter of 2012 to the third quarter of 2017. The first subsample roughly coincides with the period examined in a similar study by Nalewaik (2011).
Figure 1 illustrates the fitted relationship between the initially reported GDI-GDP growth discrepancy and subsequent revisions to quarterly GDP growth, where the latter is measured as the difference between the latest-vintage GDP growth for a given quarter and the first release of GDP growth for that quarter. For the first subsample ending in 2011, the fitted relationship is positive, that is sloping upward, and is statistically significant, consistent with the findings of Nalewaik (2011). In other words, if the initially reported GDI growth is above that of GDP, then GDP growth for that quarter will tend to be pushed up in subsequent revisions, often years later. If the initially reported growth rate of GDI is below that of GDP, then GDP growth for that quarter will tend to be pushed down in subsequent revisions.
Figure 1
Initial GDI-GDP growth discrepancy vs. later GDP revisions
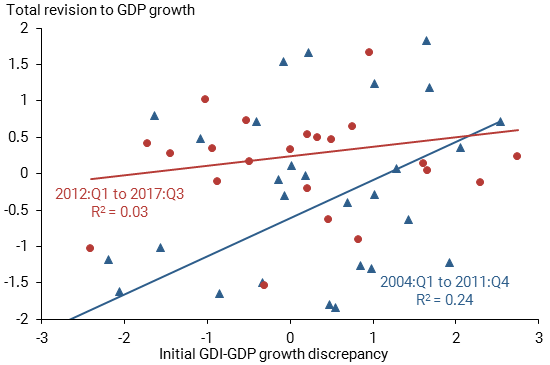
Source: Authors’ calculations using BEA data.
Note: Data are percentage point differences in inflation-adjusted annualized quarterly growth rates. R2 measures the proportion of the variance of the total revision to GDP growth explained by the initial growth discrepancy.
For the second subsample starting in 2012, there is a much weaker statistical relationship between the initially reported growth discrepancy and subsequent revisions to GDP growth. Figure 2 plots the estimated relationship from a series of rolling regressions, each using a five-year (20-quarter) moving window of data. The estimated slope coefficient starts out positive and is statistically significant, but eventually it starts declining toward zero. When the end of the moving window reaches the first quarter of 2014, the lower 95% confidence band dips into negative territory, indicating that we cannot reject the hypothesis that the true value is actually zero. The results confirm the idea that any signal about subsequent revisions to GDP growth contained in the initially reported GDI-GDP growth discrepancy has become weaker over time.
Figure 2
Estimated relationship using 5-year moving window of data
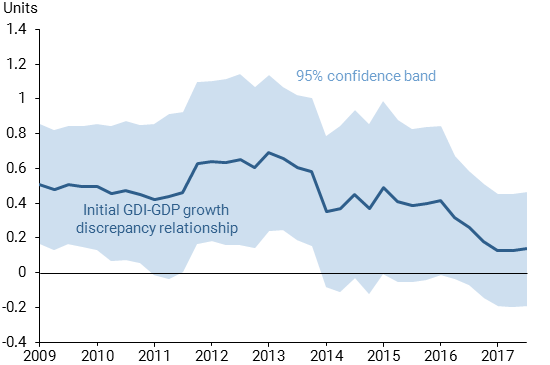
Source: Authors’ calculations using BEA data.
First revision to GDP growth
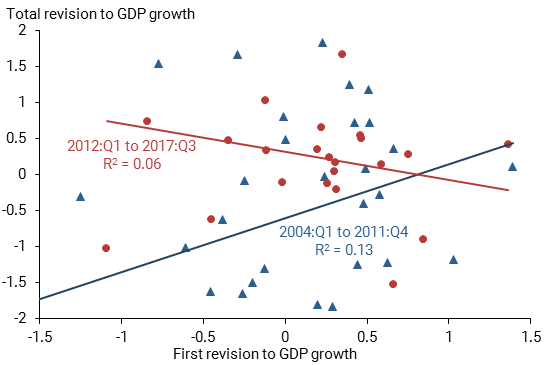
Given the breakdown in the predictive power of the initially reported GDI-GDP growth discrepancy since 2011, it is worth considering whether other data might help predict GDP growth. We explore one possibility, that the first revision to quarterly GDP growth might help forecast subsequent revisions. We define the first revision to quarterly GDP growth as the difference between the second (preliminary) estimate of GDP growth for a given quarter and the first (advance) estimate for the same quarter. As before, we measure subsequent revisions to quarterly GDP growth as the cumulative difference between the latest-vintage estimate of GDP growth for a given quarter and the first release of GDP growth for that same quarter. Figure 3 shows a positive and statistically significant relationship in our first subsample, indicating that the first revision to quarterly GDP growth does indeed contain useful information about subsequent revisions. For the second subsample, the relationship is negative but not statistically significant. Similar to the results in Figure 2, any useful signal about subsequent revisions to quarterly GDP growth has essentially disappeared in data since 2011.
Figure 3
First revision to GDP growth vs. total revision
Source: Authors’ calculations using BEA data.
Note: Data are percentage point differences in real annualized quarterly growth rates. R2 measures the proportion of the variance of the total revision to GDP growth explained by the first revision.
Conclusion
A study by Nalewaik (2011) has found that the initially reported GDI-GDP growth discrepancy contains a statistically significant signal about subsequent revisions to GDP growth. We confirm this finding for a sample period ending in the fourth quarter of 2011. After that, however, the initially reported growth discrepancy provides no reliable signal about subsequent revisions to GDP growth. Similarly, since the end of 2011, the first revision to GDP growth provides no reliable signal about subsequent revisions to GDP growth.
We can only speculate on the reasons why these statistical relationships have broken down in the more recent data. One explanation may be that evolving data collection and estimation methods have helped eliminate any systematic bias in initial reports of economic activity. For example, the BEA uses the Census Bureau’s Quarterly Services Survey to estimate personal consumption expenditures on services as part of the GDP estimate. The Census Bureau’s survey has been expanded and improved over time, which may have resulted in more accurate GDP growth estimates (Landefeld 2010 and Seskin and Holdren 2012). Improved measures of economic activity can provide policymakers with a more accurate assessment of economic conditions in real time. Given that estimates of GDP and GDI are both revised significantly over subsequent months and years, the ability to forecast the direction of subsequent revisions could be a useful input to current policy discussions. However, our results show that the ability to forecast the direction of subsequent revisions has weakened considerably in recent years.
James Aylward is an economic analyst in the Economic Research Department of the Federal Reserve Bank of San Francisco.
Kevin J. Lansing is a research advisor in the Economic Research Department of the Federal Reserve Bank of San Francisco.
Tim Mahedy is a former associate economist in the Economic Research Department of the Federal Reserve Bank of San Francisco.
References
Bureau of Economic Analysis. 2012. “Revising Economic Indicators: Here’s Why the Numbers Can Change.” BEA blog (July 23).
Council of Economic Advisers. 2015. “A Better Measure of Economic Growth: Gross Domestic Output (GDO).” Issue Brief, July.
Greenaway-McGrevy, Ryan. 2011. “Is GDP or GDI a Better Measure of Output? A Statistical Approach.” BEA Working Paper 2011-08.
Landefeld, J. Steven. 2010. “Comment on ‘The Income- and Expenditure-Side Estimates of U.S. Output Growth.’” Brookings Papers on Economic Activity (Spring), pp. 112–123.
Liu, Zheng, Mark M. Spiegel, and Eric B. Tallman. 2018. “Is GDP Overstating Economic Activity?” FRBSF Economic Letter 2018-14 (May 29).
Nalewaik, Jeremy J. 2011. “The Income- and Expenditure-Side Estimates of U.S. Output Growth—An Update to 2011:Q2.” Brookings Papers on Economic Activity (Fall), pp. 385–403.
Seskin, Eugene P., and Alyssa E. Holdren. 2012. “Annual Revision of the National Income and Product Accounts.” Survey of Current Business 92 (August).
Opinions expressed in FRBSF Economic Letter do not necessarily reflect the views of the management of the Federal Reserve Bank of San Francisco or of the Board of Governors of the Federal Reserve System. This publication is edited by Anita Todd and Karen Barnes. Permission to reprint portions of articles or whole articles must be obtained in writing. Please send editorial comments and requests for reprint permission to research.library@sf.frb.org