

Unemployment is running near its 50-year low, but inflation has not picked up as expected. This suggests that the unemployment rate consistent with stable inflation has fallen. Combining a conventional Phillips curve tradeoff between unemployment and inflation with a noninflationary unemployment rate that can change over time shows that estimates of this unemployment threshold have declined toward 4% in recent years. One possible reason for this decline is improvements in how job matches are made, reflected in unusually favorable job-finding rates for disadvantaged groups.
The U.S. unemployment rate has been very low in recent years, running at or below 4% since early 2018. It reached 3.6% earlier this year, the lowest rate recorded since December 1969. In the past, such sustained low unemployment typically has been accompanied by rising rates of wage and price inflation. This Phillips curve relationship between low unemployment and rising inflation has been called into question since the Great Recession, raising the possibility that the historical monetary policy tradeoff between labor market conditions and price stability has faded. Alternatively, changes in labor market conditions may have lowered the unemployment rate associated with rising inflation. In other words, perhaps the policy tradeoff still exists, but the maximum employment metric has shifted.
In this Economic Letter, we provide evidence suggesting that the noninflationary unemployment rate has been on a downward trend in recent years and is likely to be close to 4%. This evidence is along two dimensions: (1) macroeconomic evidence based on an estimation of a noninflationary unemployment rate that can change over time, and (2) microeconomic evidence that recent low unemployment rates have generated unusually high job-finding rates for disadvantaged groups.
Labor markets and inflation pressures
As the economic expansion enters its eleventh year, businesses have continued hiring workers at a solid pace to meet the rising demand for the goods and services they produce. Job vacancies have reached new highs, and the pool of unemployed workers looking for jobs has shrunk toward historic lows. The result is a labor market in which it is increasingly difficult for businesses to find people to fill available positions. In principle, when the unemployment rate falls below a certain threshold, the tight labor market strengthens workers’ bargaining position and hence their ability to negotiate higher wages and better working conditions. This in turn can push up wages and other costs and eventually the prices of final goods and services. The more the unemployment rate falls below this threshold, the more wage and price inflation can be expected down the road.
This threshold, or the noninflationary rate of unemployment, is central to the conduct of monetary policy and is closely related to the non-accelerating inflation rate of unemployment, or NAIRU (Friedman 1968). Its exact value varies over the long term due to slow-moving features of the labor market such as changing workforce demographics. It can also change in the short term depending on the factors propelling business cycle expansions and contractions and how employers and job seekers respond to them. For example, an improvement in overall productivity growth or the effectiveness of the job-matching process tends to lower the noninflationary rate of unemployment. Importantly, this threshold is distinct from the natural rate of unemployment, the rate toward which the economy would converge in the long run. The natural rate shares some features with the noninflationary rate of unemployment but is less responsive to short-term factors that move the noninflationary rate of unemployment.
Macro evidence: A declining noninflationary rate of unemployment
Despite being a straightforward concept, the noninflationary unemployment rate is difficult to estimate because it is not directly observable. It must be inferred from the statistical relationship between directly measured variables such as actual unemployment, inflation, and other factors that could affect the relationship between unemployment and inflation, for instance, changes in the exchange rate of the dollar. One leading approach to estimating such unobserved concepts is provided by “state space” models, which allow researchers to infer the noninflationary unemployment rate based on assumptions about its likely patterns over time and its relationship to other observable data. In particular, we incorporate the historical relationship between inflation and unemployment and jointly estimate the slope of the Phillips curve and the noninflationary rate of unemployment (Laubach 2001).
Our empirical model relies on data for the period from 1985 through the first quarter of 2019. For inflation, we use one of the Fed’s preferred measures, the price index for personal consumption expenditures excluding food and energy, or core PCE. The unemployment measure is the overall rate for workers age 16 and over.
Figure 1 shows the resulting estimate of the noninflationary rate of unemployment (red line), as well as the actual rate of unemployment (blue line) and the Congressional Budget Office (CBO) estimate of the long-run natural rate of unemployment (green line). There is a downward trend in the noninflationary rate of unemployment in the first part of the sample period, during the mid-1980s and 1990s. It was near 7% in the mid-1980s and dipped to 4% during the expansion of the late 1990s. The noninflationary rate of unemployment varies over the business cycle and around the long-run natural rate estimated by the CBO, tending to rise during recessions and fall during expansions. It was just below 5% before rising during the Great Recession beginning in December 2007. Since the end of the recession in 2009 it has generally fallen, dipping below 4.5% by the end of 2018 and continuing its downward drift towards 4% into 2019.
Figure 1
Estimates of the noninflationary unemployment rate
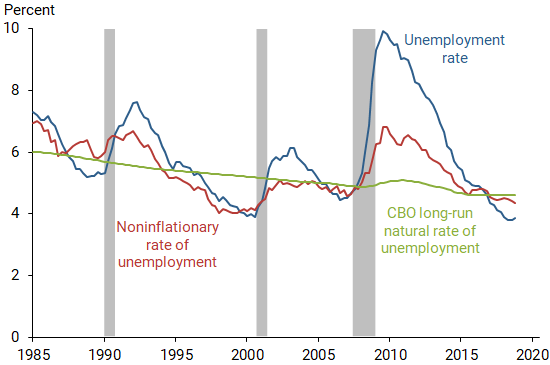
Comparing changes over time in the actual rate of unemployment and the rate associated with inflationary pressures is complicated by changes in workforce demographics. Today’s workforce is older, more diverse, and more educated than it was three decades earlier. Accounting for the influence of these factors on the unemployment rate using the methods of Daly et al. (2007) contributes to the estimated decline of the noninflationary threshold (red line) since the Great Recession. The most recent quarter indicates that the noninflationary rate of unemployment was 4.2%. Crump et al. (2019) estimate a similar downward trend and recent levels of the noninflationary unemployment rate that are close to or slightly below ours.
Micro evidence: Improved job-finding rates for disadvantaged groups
One possible source of the changes in the noninflationary unemployment rate is an improved matching process between job seekers and available positions (Daly et al. 2012). With better job matching, the number of unemployed people needed to fill existing vacancies falls, implying a lower sustainable unemployment rate. The most obvious manifestation of improved job matching is faster job-finding rates for people seeking employment.
Job-finding rates tend to rise during economic expansions, which may contribute to the cyclical variation in the noninflationary unemployment rate. This pattern is likely to be particularly pronounced for disadvantaged groups of people that face higher obstacles to achieving labor market success. In particular, recent research findings indicate that members of some disadvantaged racial and ethnic groups experience a disproportionate improvement in their labor market status as overall economic and labor market conditions strengthen (Aaronson et al. 2019).
We examine whether the pattern of relative gains for disadvantaged groups holds true for job-finding rates, similar to the findings of Aaronson et al. (2019) for other labor market outcomes such as labor force status and earnings. As in their work, we analyze three racial and ethnic groups separately by gender: white, black, and Hispanic, with the white group used as the baseline for comparison. Our analysis relies on individual data from the Current Population Survey, the monthly household survey conducted by the Bureau of Labor Statistics that is the basis for U.S. official labor force and unemployment numbers. We match individuals across consecutive months of the survey beginning in 1976 and extending through April 2019. This enables a detailed analysis of transitions between different labor force status categories. We focus on transitions from unemployment or nonparticipation in the labor force to employment.
Figure 2 shows the monthly job-finding rates for unemployed men and women by race and ethnicity. These rates are defined as the fraction of unemployed individuals in each group who find a job each month. Job-finding rates for both genders tend to be higher for whites than for the other groups, with the exception of Hispanic men, for whom job-finding rates typically are higher than for white men. The figure suggests that the Hispanic and black groups have seen particularly large improvements in job-finding rates over the past few years relative to whites.
Figure 2
Job-finding rates from unemployment by race/ethnicity
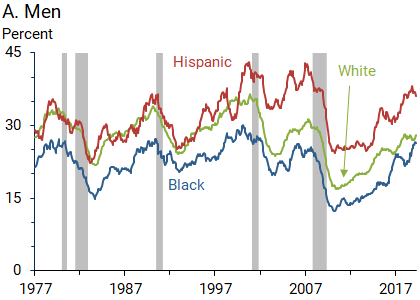
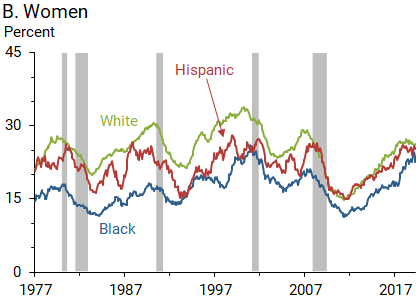
Source: Authors’ calculations from matched CPS data, 12-month moving averages.
The visual impression from Figure 2 is strongly confirmed by a formal statistical analysis. We estimate regression equations that model the difference between the job-finding rates of the Hispanic and black groups and the white group as a function of business cycle conditions. We account for cyclical effects using the gap between the actual unemployment rate and either the CBO’s estimate of the long-run natural rate or our estimate of the noninflationary rate. We augment this basic regression by allowing for changes in the estimated cyclical relationship during periods when unemployment is very low, as it has been since early 2017. Our results (not shown) confirm with high statistical precision that the job-finding rates for the Hispanic and black groups have improved substantially relative to the white group among both men and women over the past few years. We find similar results for transition rates from nonparticipation rather than unemployment.
The unusual improvement in job-finding rates for disadvantaged groups in recent years suggests that the labor market is benefitting from an enhanced job-matching process. For example, these findings are consistent with relaxed hiring standards in response to the recruiting challenges employers face in a tight labor market (Modestino, Shoag, and Ballance 2016).
Conclusions: Will inflation pressures rise?
A key question facing monetary policymakers is how much a continuation of the current tight labor market might push up inflation. We discussed macro and micro evidence consistent with the view that the noninflationary rate of unemployment has fallen during the current expansion and is heading toward 4%. This can help explain sustained low price inflation despite an unemployment rate near historical lows. It also implies that despite the very low unemployment rate, the labor market may have more room to run without pushing up price inflation substantially.
Nicolas Petrosky-Nadeau is a senior research advisor in the Economic Research Department of the Federal Reserve Bank of San Francisco.
Robert G. Valletta is a group vice president in the Economic Research Department of the Federal Reserve Bank of San Francisco.
References
Aaronson, Stephanie R., Mary C. Daly, William Wascher, and David W. Wilcox. 2019. “Okun Revisited: Who Benefits Most From a Strong Economy?” BPEA Conference Draft, March 7–8. Forthcoming in Brookings Papers on Economic Activity.
Crump, Richard K., Stefano Eusepi, Marc Giannoni, and Ayşegül Şahin. 2019. “A Unified Approach to Measuring u*.” BPEA Conference Draft, March 7–8. Forthcoming in Brookings Papers on Economic Activity.
Daly, Mary C., Osborne Jackson, and Robert G. Valletta. 2007. “Educational Attainment, Unemployment, and Wage Inflation.” FRBSF Economic Review 2007.
Daly, Mary C., Bart Hobijn, Ayşegül Şahin, and Robert G. Valletta. 2012. “A Search and Matching Approach to Labor Markets: Did the Natural Rate of Unemployment Rise?” Journal of Economic Perspectives 26(3), pp. 3–26.
Friedman, Milton. 1968. “The Role of Monetary Policy.” American Economic Review 58(1), pp. 1–17.
Laubach, Thomas. 2001. “Measuring the NAIRU: Evidence from Seven Economies.” Review of Economics and Statistics 83, pp. 218–231.
Modestino, Alicia S., Daniel Shoag, and Joshua Ballance. 2016. “Downskilling: Changes in Employer Skill Requirements over the Business Cycle.” Labour Economics 41, pp. 333–347.
Opinions expressed in FRBSF Economic Letter do not necessarily reflect the views of the management of the Federal Reserve Bank of San Francisco or of the Board of Governors of the Federal Reserve System. This publication is edited by Anita Todd and Karen Barnes. Permission to reprint portions of articles or whole articles must be obtained in writing. Please send editorial comments and requests for reprint permission to research.library@sf.frb.org