

Estimates suggest the new normal pace for U.S. GDP growth remains between 1½% and 1¾%, noticeably slower than the typical pace since World War II. The slowdown stems mainly from demographic trends that have slowed labor force growth, about which there is relatively little uncertainty. A larger challenge is productivity. Achieving GDP growth consistently above 1¾% will require much faster productivity growth than the United States has typically experienced since the 1970s.
Before the Great Recession, a GDP growth rate of 3% or higher seemed normal for the United States. For example, annual growth from 1987 to 2007 averaged 3%. In contrast, the pace since the end of the Great Recession in 2009 has been much slower, averaging only 2.3% per year through the end of 2018. Over the past two years, however, growth has averaged a bit higher at 2.7%. This raises the hope that longer-run, or trend, growth might be stronger than it appeared a few years ago—even if it is still falling short of its pre-2008 pace.
In this Letter, we update the analysis in Fernald (2016) regarding the underlying components of sustainable growth—hours worked and productivity, measured as output per hour. Despite the recent speedup in growth, we conclude that a range of 1½% to 1¾% remains a more reasonable best guess for longer-run growth.
This slow pace relative to history reflects two factors. Most importantly, demographic trends leave little doubt that the labor force will grow slowly at best over the next decade. There is more uncertainty about the other factor, productivity growth. Our forecast assumes that productivity will grow at a pace similar to recent decades. Averting this slow-growth future would require a sustained increase in productivity growth.
Differentiating the trend from the cycle
The Federal Reserve has a congressional mandate to pursue maximum employment. This means policymakers must assess what pace of growth is consistent with keeping employment at the desired level. If employment is below that level—such that unemployment is too high—then economic activity needs to grow more quickly than this longer-run sustainable trend pace to boost employment and bring unemployment down.
It can take years to achieve this employment objective. Hence, the Fed typically considers the sustainable trend to be the expected pace of growth “over the longer run (say, five to six years from now) in the absence of shocks and assuming appropriate monetary policy” (Danker 2012). We follow the same assumption in this Letter.
In practice, however, given past shocks, the convergence to this longer-run trend can be faster or slower than five to six years. Concretely, when the recovery began in 2009, the unemployment rate was close to 10%. Unemployment has fallen steadily since then, which indicates that the economy has grown faster than its sustainable pace over this entire period. The current unemployment rate is less than 4%—much closer to its sustainable level than it was in 2009.
Demographics as a driver of slow growth
Demographics are the key reason future trend growth is expected to be low relative to history. Figure 1 shows that labor force growth has slowed markedly since the 1970s, when baby boomers reached working age and female participation in the labor force rose rapidly. However, stagnating growth in female participation since the 1990s combined with projections for birth rates, immigration, and mortality suggest growth of the traditional working-age population ages 16-64 is slowing to a historically low pace.
Figure 1
Labor supply growth is slowing
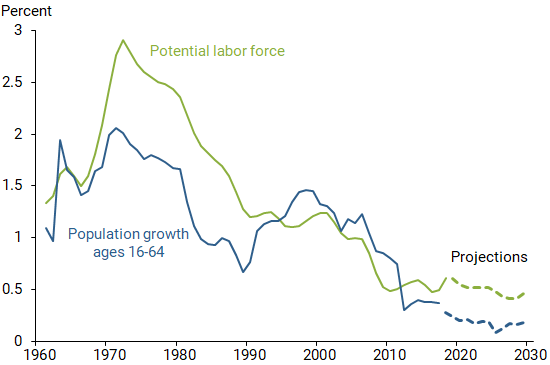
Source: CBO (2018), Census Bureau.
The Congressional Budget Office (CBO) projects that the U.S. labor force and total work hours in the economy will grow only about 0.5% per year in the mid-2020s (green dashed line). The labor force is expected to grow somewhat faster than the 16-64 population because about 20% of people over age 64 continue to work—and this age group will grow very quickly. More precisely, to project work hours, CBO staff estimate participation trends within age, sex, and education groups and combine that with detailed forecasts of future demographics. The CBO’s estimates for participation trends are similar to those of Kudlyak and Hornstein (2019), who follow a similar procedure.
Although the demographics are relatively predictable, there is some uncertainty about mapping it to longer-run hours. For example, if the only changes in participation came from the age distribution of the population, then employment would rise only about 0.4% per year. In other words, even reaching the CBO’s projected 0.5% would require some additional factor such as rising education to raise participation rates.
In contrast, suppose the overall labor force participation rate remained constant, despite the rapid growth in the over-65 population. Then the labor force and future hours would grow about 0.3 percentage points faster than in the CBO baseline. This extreme assumption would translate directly into 0.3 percentage point faster GDP growth, all else being equal.
Slow productivity growth plus demographics imply low potential growth
Figure 2 shows growth of real GDP per hour, a broad measure of labor productivity, broken into periods since 1973 that reflect variation in productivity growth. Figure 2 depicts how productivity growth has shifted between normal and exceptional periods (Fernald 2016). Unusually influential innovations—such as the steam engine, electric dynamo, internal combustion engine, and microprocessor—typically led to a host of complementary innovations that boosted productivity growth broadly for a time.
Figure 2
Labor productivity growth slowing
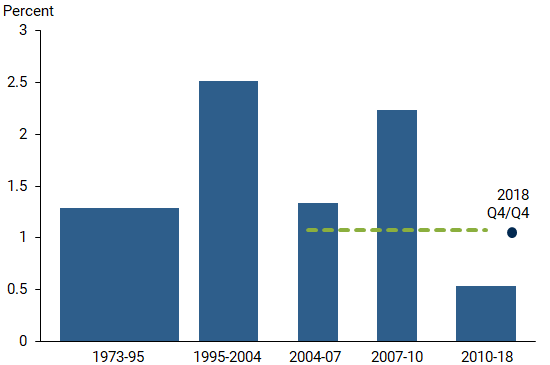
Source: Bureau of Economic Analysis.
Note: Dashed green line is average of 2004–2018.
This measure of productivity growth has slowed since 2004. The green dashed line in Figure 2 is productivity growth averaged over 2004–2018, which is very close to the 1973–1995 average pace. During the fast-growth period from 1995 to 2004, productivity growth averaged 2½%. During the slower periods of 1973–1995 and 2004–2018, growth averaged only 1% to 1¼%, and that pace dropped dramatically lower most recently in 2010–2018.
The black dot in the figure shows 2018 growth in real GDP per hour of 1.1%. This is higher than the average growth rate over 2010–2018 and may suggest a pickup in productivity growth. However, in our view, it is best to view the years since 2004 as a whole; in this case, the 2018 pace is close to the period average.
We focus on the average since 2004 because labor productivity has some persistent cyclical dynamics. The large shock of the Great Recession caused a temporary boost in productivity growth from 2007 to 2010 that has since unwound. For one thing, less-skilled workers were more likely to lose jobs in the Great Recession than more-skilled workers, who typically have higher productivity. For another, businesses came out of the Great Recession with ample productive capacity but limited demand. Over time, increases in capacity per worker are an important source of productivity growth, but for a time after the recession, businesses could meet the recovery in demand without investing. Hence, that capacity channel was temporarily dialed down.
Once we average over the transitory ups and downs, it appears that we have been in a slow growth regime for the past 15 years. Regimes generally appear persistent—lasting a decade or longer. For this reason, our most likely or “modal” estimate is that the slow-growth regime will continue for at least the next few years.
That said, productivity is highly uncertain in both a statistical and an economic sense. Under the regime view of productivity growth, much of the statistical uncertainty is about which regime we will be in. Neither economists nor statisticians have a good track record of forecasting changes in trend productivity growth. In addition, even within a regime, productivity is inherently volatile from year to year.
Economically, major technological gains could remain narrowly focused, leaving modest and incremental productivity growth as the norm for the broader economy, as we assume in our benchmark. Or, we might see another broad-based wave of the IT revolution. Alternatively, future growth might look substantially different from the past, reflecting the innovative contributions of robots and machine learning.
Despite this inherent uncertainty, our best guess is that productivity growth over the next five to six years will be in line with previous slow regimes. During those regimes, GDP per hour rose around 1–1¼% per year.
Projection of output growth
In Figure 3, we add projections of hours and productivity growth to estimate future output growth. As a point estimate, we use the 2004–2018 average of 1.1% per year growth in GDP per hour. Combining that with the CBO’s projected growth in hours of 0.5% per year results in our preferred modal estimate for GDP growth of 1.6% per year.
Figure 3
Scenarios for output growth: slow and fast labor productivity
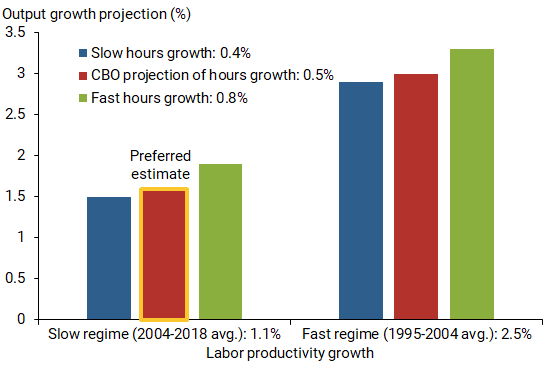
If hours were to grow more slowly than the CBO projection, say 0.4%, it would result in output growing only 1.5%. Even in the extreme case in which aging does not lower the overall employment rate, output could grow only about 1.9%, as shown in the left-hand side green bar in Figure 3. Hence, without a revival in productivity growth, output growth is unlikely to return consistently to 2%, let alone 3%.
Of course, the right-hand group of bars in Figure 1 shows output growth could return to 3% if productivity growth speeds up like it did in the last fast-growth regime. Note that we have seen extended periods of slow productivity growth before. What we haven’t seen before is slow productivity growth combined with weak growth in hours.
Other considerations
Fernald (2016) provides a more formal analysis of growth fundamentals and argues that two economic factors not separately analyzed here largely offset each other. On the one hand, his detailed growth model suggests that physical and intangible capital deepening should provide a larger productivity boost than we saw historically because the prices of investment goods have declined more quickly. On the other hand, Bosler et al. (2019) argue that labor quality, sometimes called human capital, will add less per year to productivity growth than it has historically, since we will not repeat the massive 20th century increase in educational attainment.
Our benchmark assumes that any investment or labor supply results from the 2017 Tax Cuts and Jobs Act (TCJA) will have minimal effects on potential growth five to six years out. This is consistent with the analysis in Congressional Budget Office (2018) and other studies. These suggest any boost to investment and labor supply growth is likely to be temporary, with little impact on potential GDP growth beyond the next few years.
Conclusions
The solid growth in GDP over the past year naturally raises the question of whether we have been understating the potential trend. Nevertheless, it is far too early to declare that trend growth is higher than current estimates of 1.6–1.7%. The most natural interpretation of the strength in hours worked is that any structural element represents an effect on the levels of employment, hours, and potential output—perhaps in response to the TCJA—not a persistent growth effect. Policy changes such as family-friendly policies common in other OECD economies might lead to trend increases in labor force participation (Daly et al. 2018). But such policies are unlikely to be implemented soon.
John Fernald is a senior research advisor in the Economic Research Department of the Federal Reserve Bank of San Francisco.
Huiyu Li is a senior economist in the Economic Research Department of the Federal Reserve Bank of San Francisco.
References
Bosler, Canyon, Mary C. Daly, John G. Fernald, and Bart Hobijn. 2019. “The Outlook for U.S. Labor-Quality Growth.” Chapter 3 in Education, Skills, and Technical Change: Implications for Future U.S. GDP Growth, eds. Charles R. Hulten and Valerie A. Ramey. Cambridge, MA: National Bureau of Economic Research, pp. 61–110.
Congressional Budget Office. 2018. The Budget and Economic Outlook: 2018 to 2028. Report, April.
Daly, Mary C., Joseph H. Pedtke, Nicolas Petrosky-Nadeau, and Annemarie Schweinert. 2018. “Why Aren’t U.S. Workers Working?” FRBSF Economic Letter 2018-24 (November 13).
Danker, Deborah. 2012. “Request for January Projections.” Memo to Governors and Reserve Bank Presidents from FOMC Secretariat, January 13.
Fernald, John. 2016. “Reassessing Longer-Run U.S. Growth: How Low?” FRB San Francisco Working Paper Series 2016-18.
Hornstein, Andreas, and Marianna Kudlyak. 2019. “Aggregate Labor Force Participation and Unemployment and Demographic Trends.” FRB San Francisco Working Paper 2019-07, February.
Opinions expressed in FRBSF Economic Letter do not necessarily reflect the views of the management of the Federal Reserve Bank of San Francisco or of the Board of Governors of the Federal Reserve System. This publication is edited by Anita Todd and Karen Barnes. Permission to reprint portions of articles or whole articles must be obtained in writing. Please send editorial comments and requests for reprint permission to research.library@sf.frb.org