
Productivity growth shows evidence of switching between long periods of high and low average growth. Estimates suggest that the United States has been in the low-growth regime since 2004. Assuming this low growth continues, productivity growth in the year 2025 would be 0.6%. By dropping this assumption and allowing for a switch to consistent higher growth, an alternative estimate forecasts that the distribution of possible productivity growth across quarters could average about 1.1% in 2025.
Economic growth in the United States has been relatively low by historical standards since the mid-2000s. Low productivity growth has been a main culprit contributing to this lackluster growth (see, for example, Fernald and Li 2019). Productivity growth allows the economy to produce more output with the same level of inputs such as worker hours and capital. Understanding how productivity has evolved in the past can help indicate how future economic growth might evolve and whether the relatively sluggish growth of recent years is likely to continue.
Over the past 70 years, the United States has had extended periods of relatively high productivity growth followed by relatively low growth. In other words, productivity seems to switch between different “regimes” of high and low growth. In this Economic Letter, we summarize evidence in Foerster and Matthes (2020) that suggests productivity tends to move between long lasting but not permanent regimes of high or low average growth. These periods show higher average growth from 1947 through the 1970s, followed by a period of lower average growth until the information technology (IT) boom of the 1990s, and then lower average growth since the mid-2000s.
We created a model that calculates a probability of being in each regime in a given quarter. Current evidence indicates around a 75% probability that the economy was in a low-growth period in the fourth quarter of 2019. We use this evidence to forecast productivity growth for the year 2025. Given that regimes seem to be long lasting, our baseline forecast assumes the low-growth regime continues, which gives an estimate of 0.6% productivity growth in 2025. However, some evidence supports the possibility of productivity switching to a higher-growth regime; accounting for this alternative, we develop an alternative forecast of 1.1% productivity growth in 2025.
Regimes in productivity growth
We focus on total factor productivity (TFP) as described in Fernald (2014), which measures productivity in the U.S. business sector from 1947 to the end of 2019. Figure 1 shows that, relative to the beginning of the series, growth has been uneven both quarterly and over longer periods of time lasting years or decades.
Figure 1
Total factor productivity, 1947–2019
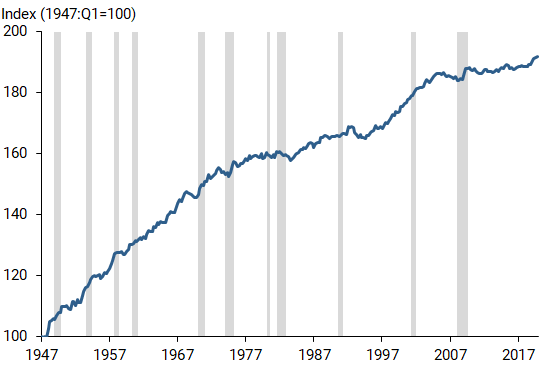
Source: Fernald (2014).
Fernald (2016) and Fernald and Li (2019) study specific shorter periods for GDP growth, of which TFP growth is a primary contributor. They calculate 2% average TFP growth for 1947–1973 and 1996–2004, 0.6% average growth for 1974–1995, and 0.4% average growth since 2004. Similarly, Foerster et al. (2019) find that productivity growth rates at the sector level imply aggregate productivity growth moves between periods of higher and lower growth.
To study the tendency of productivity growth to move between periods of higher and lower growth, we estimate a statistical model known as a regime-switching model in Foerster and Matthes (2020). This model formalizes the idea that productivity moves between extended periods of higher and lower average growth, while still allowing for quarterly movements away from the overarching lower and higher averages. While we have data available to measure productivity growth, we do not know which regime is in place at any given time and must infer it based on historical data. The model estimates the probability of being in the high- or low-growth regime at a given point in time plus the average growth rates of the two regimes. To do so, the model breaks down the annualized quarterly growth rate into an average growth rate that depends upon being in a high- or low-growth regime, plus a temporary deviation from that average.
In addition, the model allows for switches between the two growth regimes. These switches capture the idea that, for example, the IT boom may boost productivity for an extended time, but at some point the boost will wear off and lower growth will resume. Similarly, a period of lower growth—such as the period since the mid-2000s—will not last forever, but there’s no way to know exactly when the next increase in productivity—for instance, from increased automation—will arrive.
The estimated regime-switching model indicates that productivity has distinct and long-lasting high- and low-growth regimes. High-growth periods average about 2.0% in annualized quarterly TFP growth, while slower periods average about 0.6%. These estimates are in line with the subsamples studied by Fernald (2016) and Fernald and Li (2019). The model shows few switches between regimes, which have an average duration of about 60 quarters, or 15 years. This reflects the few changes the U.S. economy has undergone in average productivity growth since 1947.
While we can observe productivity growth moving between high and low levels of growth, it can be hard to know which regime is in place at a given time. For example, if productivity growth is high in one quarter, is that because growth is in the high-growth regime and will therefore tend to be high for some time, or is it only a temporary blip during a low-growth regime? Our model can help distinguish more persistent periods of growth, such as the IT boom, from temporary boosts in an otherwise slow period. It does so by accounting for regime changes being relatively rare, such that only repeated strong growth numbers would indicate a change to a higher-growth regime.
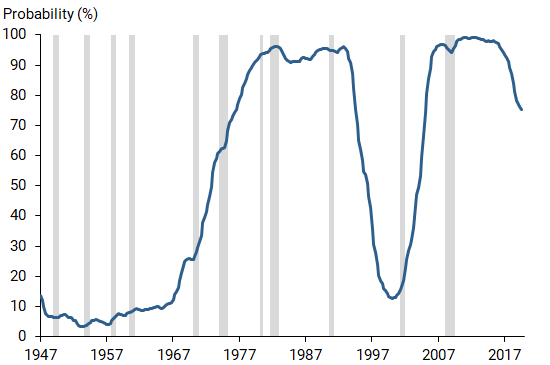
Figure 2 shows the model-implied probability that the U.S. economy was in the low-growth regime for each quarter since 1947. When the line is close to zero, the economy was most likely in the high-growth regime, while intermediate values indicate varying degrees of uncertainty, ranging up to 100% probability of low growth. These estimates broadly follow the growth periods considered by Fernald (2014), and Fernald and Li (2019). In the early years of our sample, the model indicates a high-growth regime with over 90% probability, depicted as less than 10% probability of low growth. Starting in the late 1960s, the probability starts moving upward indicating the low-growth regime is more likely. However, rather than a sharp move, the probability line only hits 90% around 1980, indicating a high level of uncertainty about which regime is actually in place during the 1970s. From around 1980 to the early 1990s, the model puts high probability on the low-growth regime. Then during the 1990s, the probability moves toward the high-growth regime. This movement is short-lived, as the economy reverts to the low-growth regime with nearly 100% probability after the Great Recession. At the very end of our sample, however, the probability of being in the low-growth regime starts to descend, indicating a potential return toward higher growth. In the final quarter of the sample, the fourth quarter of 2019, the model estimates about a 75% chance that the economy is in the low-growth regime. This last estimate reflects notable increases in productivity growth during the latter part of the last expansion, though it is too soon to tell whether this indicates a temporary increase—a blip—or a more sustained increase.
Figure 2
Model-implied probability of the low-growth regime
Forecasting productivity growth using regime change
Given the regime-switching nature of productivity growth, we use the model to forecast where growth might be in the future. In two scenarios, productivity could continue on the path towards higher growth. An optimistic view would suggest that recent advances in automation could create a boost in productivity growth similar to that seen during the IT boom of the 1990s. A more pessimistic view would suggest that the recovery from the COVID-19 pandemic could artificially boost productivity growth for an extended time as the economy repairs damages. In this view, the disruption may have destroyed factors that implicitly affect productivity, such as worker-firm relationships or the organization of supply chains, to such a degree that a period of high productivity growth will ensue as businesses and workers repair, rebuild, or redevelop those factors simply to get back to the previous level of economic activity.
We focus on predicting the annual growth rate of productivity for 2025, the closest future date that would allow us to focus on longer trends rather than short-run fluctuations. We first focus solely on the low-growth regime for a baseline forecast. For this approach, we assume that the economy was in the low-growth regime at the end of 2019 and, as a result, consider it likely for that low-growth regime to continue through 2025. Since the low-growth regime averages 0.6% annualized quarterly growth over our sample, the baseline model forecasts growth in 2025 to be 0.6%.
Alternatively, the estimated regime-switching model produces a more comprehensive forecast that takes several sources of uncertainty into account. First, there is some uncertainty about the regime in place at the end of 2019, with about 75% probability of it being in the low-growth regime. Second, there is uncertainty about what regime will be in place in 2025. Although regimes tend to be long lasting, there is always a chance that the economy will switch. Third, beyond the average growth, there are temporary deviations in any given quarter that generate fluctuations.
Figure 3 shows the implied distribution of productivity growth in 2025 when we average the model’s quarterly annualized growth forecast for that year. The distribution shows that a wide range of growth is possible, due in large part to the variance of the temporary component of quarterly growth. However, some uncertainty reflects the fact that our prediction only slightly favors the low-growth regime continuing throughout 2025, with only around 60% probability. In fact, the average forecast across quarters for 2025 is for 1.1% growth, reflecting a 40% probability of a switch to a higher-growth regime of around 2% growth per year.
Figure 3
Estimated forecast distribution for TFP growth in 2025
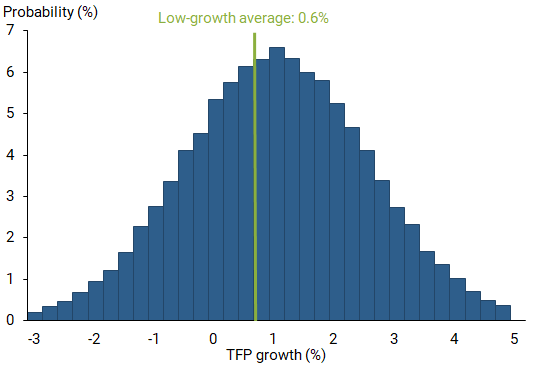
The green line in Figure 3 shows a forecast of 0.6% growth conditional on the economy remaining in the low-growth regime. Relative to this baseline view, the growth forecast shows some probability that we will be in a high-growth regime in 2025, skewing our prediction above that of continued low growth.
Conclusion
Productivity growth has switched between extended periods of higher and lower average growth since 1947. While the economy appears to have settled into a low-growth regime since the mid-2000s, estimates from the end of 2019 suggest it might have started to move toward higher growth. If this proves to be a temporary blip and the low-growth regime continues, we would expect productivity growth to be 0.6% in 2025. However, by taking into account the regime-switching nature of growth, we offer an alternative forecast that average productivity growth could rise to about 1.1% in 2025.
Andrew Foerster is a research advisor in the Economic Research Department of the Federal Reserve Bank of San Francisco.
Christian Matthes is an associate professor at Indiana University.
Lily M. Seitelman is a research associate in the Economic Research Department of the Federal Reserve Bank of San Francisco.
References
Fernald, John. 2014. “A Quarterly, Utilization-Adjusted Series on Total Factor Productivity.” FRB San Francisco Working Paper 2012-19.
Fernald, John. 2016. “Reassessing Longer-Run U.S. Growth: How Low?” FRB San Francisco Working Paper Series 2016-18.
Fernald, John, and Huiyu Li. 2019. “Is Slow Still the New Normal for GDP Growth?” FRBSF Economic Letter 2019-17 (June 24).
Foerster, Andrew, Andreas Hornstein, Pierre-Daniel Sarte, and Mark Watson. 2019. “How Have Changing Sectoral Trends Affected GDP Growth?” FRBSF Economic Letter 2019-18 (July 8).
Foerster, Andrew, and Christian Matthes. 2020. “Learning about Regime Change.” FRB San Francisco Working Paper Series 2020-15.
Opinions expressed in FRBSF Economic Letter do not necessarily reflect the views of the management of the Federal Reserve Bank of San Francisco or of the Board of Governors of the Federal Reserve System. This publication is edited by Anita Todd and Karen Barnes. Permission to reprint portions of articles or whole articles must be obtained in writing. Please send editorial comments and requests for reprint permission to research.library@sf.frb.org