
Inflation fell dramatically following the onset of the COVID-19 pandemic. Dividing the underlying price data according to spending category reveals that a majority of the drop in core personal consumption expenditures inflation comes from a large decline in consumer demand. This demand effect far outweighs upward price pressure from COVID-related supply constraints. A new monthly data page from the San Francisco Fed tracks how sensitivity to the economic disruptions of COVID-19 affects different categories of inflation over time (discontinued September 2023).
The unprecedented challenges caused by the coronavirus disease 2019 (COVID-19) pandemic has brought about abrupt and severe disruptions to economic activity. Social distancing sharply reduced consumer spending, particularly in sectors more sensitive to these measures such as restaurants and hotels (Dunn, Hood, and Driessen 2020). The pandemic also disrupted the supply chain, as many employees could not safely go to their workplace, reducing production below full capacity in certain sectors. By contrast, other sectors of the economy, such as information technology, appear to have been less, or even positively, affected by the pandemic (Kwan and Mertens 2020).
While there is extensive research evaluating the impact of COVID-19 on consumer spending and the labor market, few studies have focused on inflation. In this Economic Letter, I employ a method of monitoring the effects of COVID-19 on core personal consumption expenditures (PCE) inflation using a framework similar to that used in Mahedy and Shapiro (2017) and Shapiro (2018). I divide the subcategories of core PCE inflation into two mutually exclusive groups: COVID-sensitive and COVID-insensitive. Inflation within the COVID-sensitive group is more likely to be driven by events directly related to the pandemic, such as mandatory and voluntary social distancing, stay-at-home orders, or supply chain disruptions. Inflation in the insensitive group is less likely to be directly impacted by such factors.
The decomposition is designed to help researchers and policymakers monitor the direct effects of COVID-19 on inflation; data will be updated monthly on a new web page (discontinued September 2023). As of the latest data, core PCE inflation remains low primarily because of the direct effects of COVID-19—that is, a decline in inflation for goods and services produced by COVID-sensitive sectors. Digging deeper reveals that COVID-sensitive inflation, and core PCE inflation more broadly, are being driven by products with large declines in both price and quantity, suggesting a drop in demand. By contrast, COVID-related supply constraints, which would push quantities down but prices up, are not as dominant.
COVID-sensitive versus COVID-insensitive inflation
Inflation fell dramatically following the onset of the COVID-19 pandemic. In February 2020, the month before the outbreak in the United States, the year-over-year change in core PCE inflation stood at 1.9%, very close to the Federal Reserve’s 2% inflation target. By April, it had fallen to 0.9%, its lowest level since 2010. The timing of this precipitous decline strongly suggests that it was driven by disruptions related to COVID-19.
I start with the PCE price index produced monthly by the Bureau of Economic Analysis, focusing on the core index that removes volatile food and energy prices. I drill down to isolate individual categories of core inflation that respond more to the economic disruptions caused by COVID-19. To do so, I define a category as being sensitive to the disruptions caused by COVID-19 if either price or quantity changed in a meaningful way following the onset of the pandemic. Specifically, I measure the percent change in price and quantity in the months immediately preceding and following the onset for each category—that is, between February and April 2020.
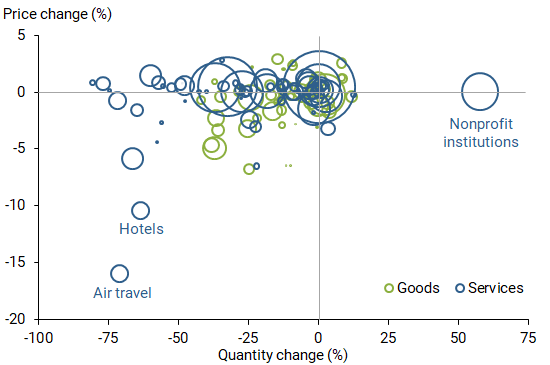
Figure 1 depicts the price and quantity percent changes of these 124 categories, with circle sizes proportional to category shares of overall expenditures. Service categories (blue circles) experienced substantially larger changes in quantity and price compared to goods categories (green circles). In particular, air travel and hotels, in the bottom left corner of the figure, experienced extraordinarily large declines in both price and quantity. At the other extreme, nonprofit institutions serving households—that is, private organizations with tax-exempt status—experienced an extraordinarily large increase in quantity.
Figure 1
Changes in price and quantity for goods versus services
I then place each of the 124 categories into one of two groups: COVID-sensitive or COVID-insensitive. Sensitive categories are those that experienced a quantity or price change—either positive or negative—between February and April 2020 that is statistically significantly different from its average change over the preceding 10 years. Sensitive categories, the blue circles in Figure 2, panel A, generally lie furthest from the origin, which is where the zero lines cross. However, some categories closer to the origin are labeled as sensitive if their prices and quantities are normally quite stable, which lowers the threshold for being sensitive to COVID-19. This classification of categories into COVID-sensitive and COVID-insensitive groups will remain fixed for all future updates of the inflation decomposition. More details of the framework are available in Shapiro (2020).
Figure 2
Categories in PCE inflation according to sensitivity versus insensitivity to COVID-19
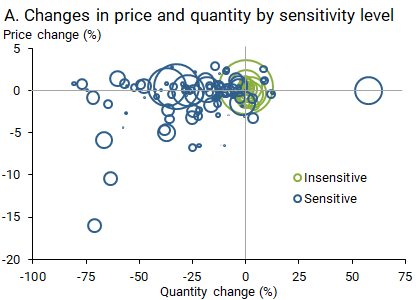
Sensitive categories make up approximately two-thirds of expenditures in the core PCE index; hospital services, restaurant services, and physician services are among the largest of these categories. The insensitive group (green circles) includes those categories with only negligible changes in price and quantity and therefore appears close to the origin. These categories make up the remaining one-third of expenditures in core PCE and include large categories such as housing services, pharmaceutical products, and charges for financial services.
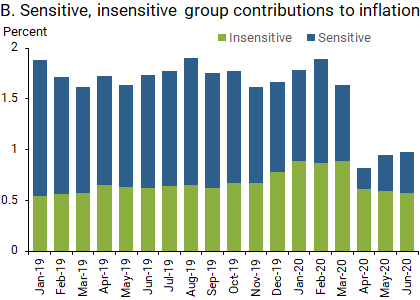
Based on this categorization, I construct two distinct subcomponents of core PCE inflation: COVID-sensitive and COVID-insensitive. Panel B of Figure 2 shows these two components as portions of year-over-year core PCE inflation. Blue bars represent the contribution from the sensitive group and the green bars represent the contribution from the insensitive group.
In February 2020, COVID-sensitive categories contributed 1 percentage point and COVID-insensitive inflation contributed 0.9 percentage point to total year-over-year core PCE inflation. In the latest data for June, the contributions declined to 0.4 for sensitive and 0.6 for insensitive categories. COVID-sensitive inflation is therefore responsible for about two-thirds of the 0.9 percentage point decline in year-over-year inflation between February and June. Although COVID-insensitive inflation fell between February and May, it was declining from a temporary high level in early 2020. Its contribution in June is roughly the same as it was over the course of 2019. By contrast, COVID-sensitive inflation in June was well below its 2019 levels.
What’s driving COVID-sensitive inflation?
Several economic forces could have caused the strong decline in COVID-sensitive inflation. The disruptions associated with COVID-19 likely resulted in shifts in both the supply and demand of goods and services. Mandatory and voluntary social distancing caused consumers to pull back demand for many products, notably restaurants, air travel, and hotels. Simultaneously, many employees remain unable to go safely back into the workplace, which places constraints on the amount of goods and services that can be produced.
To examine the separate roles of supply and demand factors, I further divide the categories within the COVID-sensitive inflation group. I rely on the basic microeconomic theory of how prices and quantities respond to demand versus supply shifts. Shifts in demand should move both prices and quantities in the same direction, while shifts in supply should move them in opposite directions. While in reality, products are affected by shifts in both demand and supply at any given time, this simple differentiation indicates which type of shift is dominant.
I place each category within the COVID-sensitive group into three distinct subgroups: demand sensitive, supply sensitive, and ambiguous. Demand-sensitive categories are those COVID-sensitive categories where quantity and price changed in the same direction between February and April 2020, both at a statistically significant level relative to the preceding 10-year average. Some of the largest categories within this demand-sensitive group are air travel and hotels. Supply-sensitive categories are those for which prices and quantities moved in opposite directions, both at a statistically significant level. Categories in this supply-sensitive group include flowers and seeds, major household appliances, and musical instruments. The ambiguous group includes those categories with a statistically significant change in either price or quantity, but not in both. I find that demand-sensitive categories make up 18% of COVID-sensitive inflation, supply-sensitive categories make up 7%, and the remaining ambiguous categories make up 75%. Thus, very few categories experienced a clear supply or demand shift, on net. Rather, most categories within the COVID-sensitive group experienced some combination of supply and demand shifts.
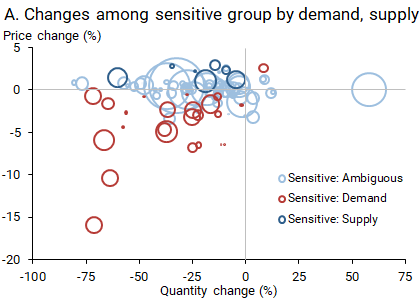
Panel A of Figure 3 shows where these COVID-sensitive categories lie in terms of price and quantity change. By construction, the demand-sensitive categories will lie in either the lower-left quadrant, shifting toward lower demand, or upper-right quadrant, with higher demand. The supply-sensitive categories will lie in the upper-left quadrant, shifting toward lower supply, or lower-right quadrant, toward higher supply. Panel A shows that the demand-sensitive categories (red circles), primarily lie in the lower-left quadrant, indicating that demand fell. Analogously, the supply-sensitive categories (dark blue circles) lie in the upper-left quadrant, indicating that supply fell. The remaining ambiguous categories (light blue circles) primarily show large quantity declines but only small price changes. This implies that these ambiguous categories may have experienced declines in both supply and demand.
Figure 3
Categorizing COVID-sensitive inflation by effects from demand versus supply
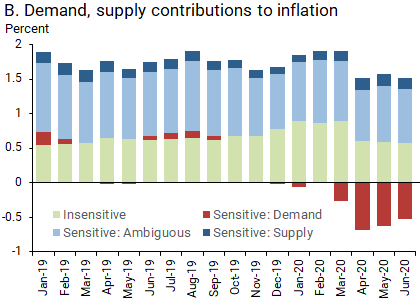
Panel B of Figure 3 measures the extent to which these three subgroups have contributed to the decline in core PCE inflation. The red bars represent the contribution to core PCE from the categories in the demand-sensitive group, the dark blue bars represent the contribution from the supply-sensitive group, and the light blue bars represent the contribution from the ambiguous group. The contribution from the COVID-insensitive group are also displayed in light green.
The results show that demand-sensitive inflation began declining as early as March, subtracting 0.3 percentage point from year-over-year core PCE inflation that month. By April, it subtracted 0.7 percentage point from year-over-year core PCE inflation. The effect from demand-sensitive factors appears to be slowly eroding, as it subtracted 0.5 percentage point in June. Supply-sensitive and ambiguous categories are contributing approximately the same as they were before the COVID-19 pandemic. Thus, as of yet, the majority of the decline in COVID-sensitive inflation, and therefore core PCE inflation, can be explained by a strong decline in demand.
Conclusion
Months after the onset of COVID-19 in the United States, core PCE inflation remains at particularly low levels—approximately a full percentage point below the Federal Reserve’s 2% target. Breaking down the components of inflation as proposed in this Economic Letter, and discussed in more detail in Shapiro (2020), can help monitor the impact of the pandemic on inflation. Consistent with the findings of Leduc and Liu (2020), current data show that the recent drop in core PCE inflation is mainly attributable to large declines in consumer demand for goods and services stemming from COVID-19, which have more than offset any upward inflation pressures due to supply constraints in some sectors.
Future updates to this data series may help researchers and policymakers understand how disruptions directly associated with the pandemic are impacting inflation. The COVID-sensitive and COVID-insensitive core PCE inflation series will be updated monthly on the San Francisco Fed’s website, Inflation Sensitivity to COVID-19 (discontinued September 2023).
Adam Hale Shapiro is a research advisor in the Economic Research Department of the Federal Reserve Bank of San Francisco.
References
Dunn, Abe C., Kyle K. Hood, and Alexander Driessen. 2020. “Measuring the Effects of the COVID-19 Pandemic on Consumer Spending Using Card Transaction Data.” Bureau of Economic Analysis Working Paper 2020-05, April 24.
Kwan, Simon H., and Thomas M. Mertens. 2020. “Market Assessment of COVID-19” FRBSF Economic Letter 2020-14 (May 28).
Leduc, Sylvain and Zheng Liu. 2020. “The Uncertainty Channel of the Coronavirus” FRBSF Economic Letter 2020-07 (March 30).
Mahedy, Tim, and Adam Hale Shapiro. 2017. “What’s Down with Inflation?” FRBSF Economic Letter 2017-35 (November 27).
Shapiro, Adam Hale. 2018. “Has Inflation Sustainably Reached Target?” FRBSF Economic Letter 2018-26 (November 26).
Shapiro, Adam Hale. 2020. “A Simple Framework to Monitor Inflation” FRB San Francisco Working Paper 2020-29.
Opinions expressed in FRBSF Economic Letter do not necessarily reflect the views of the management of the Federal Reserve Bank of San Francisco or of the Board of Governors of the Federal Reserve System. This publication is edited by Anita Todd and Karen Barnes. Permission to reprint portions of articles or whole articles must be obtained in writing. Please send editorial comments and requests for reprint permission to research.library@sf.frb.org