
Growth forecasts by Federal Open Market Committee meeting participants were persistently too optimistic for 2008 through 2016. The typical forecast started out high but was revised down over time, often dramatically, as incoming data failed to meet expectations. In contrast, forecasts for 2017 through 2019 started low but were revised up over time. Cumulative forecast revisions for these years were much smaller on average than in the past. These observations suggest that participants have adjusted their forecast methodology, including lowering estimates of trend growth, to eliminate the prior optimistic bias.
In November 2007, the Federal Open Market Committee (FOMC) began releasing projections for real GDP growth four times per year in its Summary of Economic Projections (SEP). Among other forecasts, the SEP includes the central tendency and range of real GDP growth forecasts for the next three years and over the longer term from the FOMC meeting participants, namely, the sitting Federal Reserve Board Members and the twelve Federal Reserve Bank Presidents.
The SEP central tendency midpoint growth forecasts for the years 2008 through 2016 were all revised down over time, often dramatically, as incoming data failed to meet expectations. Specifically, the initial forecast for a given year was higher than the final forecast for the same year. In eight out of nine of those years, the initial SEP forecast was also higher than the Bureau of Economic Analysis’ (BEA’s) first reported growth rate for the year—implying overoptimism in the initial forecasts.
However this pattern changed for the years 2017 through 2019: the SEP forecasts for these years started out low but were revised up over time. Moreover, the initial forecasts for 2017 through 2019 were lower than the BEA’s first reported growth rates for these years—implying some conservatism in the initial SEP forecasts. The consensus private-sector growth forecasts compiled by the Blue Chip Economic Survey show a similar pattern. This Economic Letter provides a detailed look at the evolution of the SEP growth forecasts for the years 2008 through 2019. The observed pattern suggests that SEP participants have adjusted their forecast methodology, including lowering their estimates of the economy’s trend growth rate, to eliminate the prior bias toward optimism and thereby improve forecast accuracy.
Persistent overoptimism: 2008 through 2016
Figures 1 through 3 show the evolution of the SEP central tendency midpoint forecasts of real GDP growth for the years 2008 through 2016. The vertical axis indicates the growth forecast for a given year, while the horizontal axis indicates the month and year the forecast was released. To provide some context about contemporaneous developments in the economy, the light blue bars indicate the trailing 12-month percentage change in the Standard & Poor’s (S&P) 500 stock price index that would have been observed on the date shown. An X marks the BEA’s first reported growth rate for each year, typically released in January of the following year. Earlier work on this topic (Lansing and Pyle 2015) detailed the forecast trends in the first group of years, 2008 through 2013, as shown in Figures 1 and 2.
Figure 1
SEP central tendency midpoint forecasts: 2008 to 2010
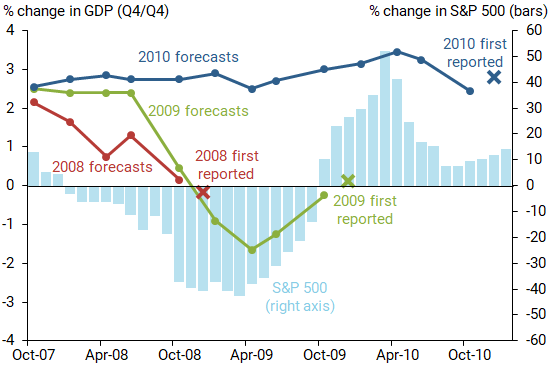
Notes: S&P 500 change is the 12-month percent change. Dots mark the SEP forecast release dates; X marks the BEA’s first reported Q4/Q4 real GDP growth rate for the year, typically released in January of the following year.
Source: Federal Open Market Committee Minutes, S&P 500.
Figure 2
SEP central tendency midpoint forecasts: 2011 to 2013
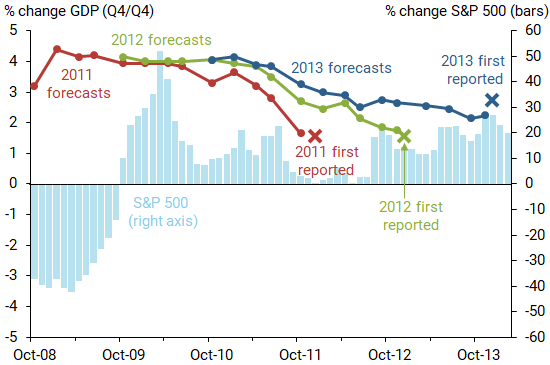
Notes: S&P 500 change is the 12-month percent change. Dots mark the SEP forecast release dates; X marks the BEA’s first reported Q4/Q4 real GDP growth rate for the year, typically released in January of the following year.
Source: Federal Open Market Committee Minutes, S&P 500.
Figure 3
SEP central tendency midpoint forecasts: 2014 to 2016
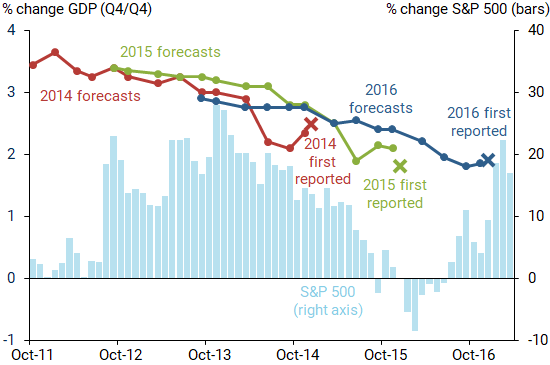
Notes: S&P 500 change is the 12-month percent change. Dots mark the SEP forecast release dates; X marks the BEA’s first reported Q4/Q4 real GDP growth rate for the year, typically released in January of the following year.
Source: Federal Open Market Committee Minutes, S&P 500.
In all three figures, the initial SEP forecast for a given year is higher than the final forecast for that same year—implying a net downward revision to the forecast. The pattern of revisions from the initial to the final forecast appears roughly correlated with movements in the S&P 500 index. These movements would be expected to capture investors’ reactions—and perhaps FOMC meeting participants’ reactions—to incoming economic data and its implications for future growth, among other things. The net downward forecast revisions for the years 2008 through 2016 averaged –1.6 percentage points per year. Excluding the Great Recession years of 2008 and 2009, the net downward revision averaged –1.3 percentage points per year. The largest net downward revision in the post-recession years was –2.4 percentage points for 2012.
One way to assess forecast accuracy is to compare the initial SEP forecast to the BEA’s first reported growth rate. With the exception of 2010, the initial forecasts for the years 2008 through 2016 were all higher than the BEA’s first reported growth rate for that year—implying overoptimism in the initial SEP forecasts. Overoptimism for the years 2008 through 2016 averaged 1.5 percentage points per year. Two of the largest measures of overoptimism occurred for the recession years of 2008 and 2009, when the initial SEP forecasts exceeded the BEA’s first reported growth rates by 2.3 and 2.4 percentage points, respectively.
It is perhaps not surprising that the SEP participants failed to predict the Great Recession. In a cross-country study of professional economic forecasters from 1989 to 1998, Loungani (2001) finds that “the record of failure to predict recessions is virtually unblemished.”
Notwithstanding the typical failure to predict recessions, it is worth considering whether some warning signals about the Great Recession went unheeded. The report of the U.S. Financial Crisis Inquiry Commission (2011) states, “Despite the expressed view of many on Wall Street and in Washington that the crisis could not have been foreseen or avoided, there were warning signs. The tragedy was that they were ignored or discounted” (p. xvii). The report lists such red flags as “an explosion in risky subprime lending and securitization, an unsustainable rise in housing prices, widespread reports of egregious and predatory lending practices, [and] dramatic increases in household mortgage debt.” In an analysis of the New York Fed’s failure to predict the Great Recession, Potter (2011) identifies three main culprits: a “misunderstanding of the housing boom…[which] downplayed the risk of a substantial fall in house prices”; a “lack of analysis of the rapid growth of new forms of mortgage finance”; and the “insufficient weight given to the powerful adverse feedback loops between the financial system and the real economy.”
If we exclude 2008 and 2009, then the overoptimism in the initial SEP forecasts averaged 1.3 percentage points per year. This figure is substantial considering that the average compound growth rate of U.S. real GDP for the decade following the end of the Great Recession was 2.3%. If the initial SEP forecasts for 2010 onward had actually panned out, then the level of real GDP at the end of 2016 would have been about 9% higher than the corresponding level implied by the BEA’s first reported growth rates.
Eliminating the overoptimism: 2017 through 2019
In a May 2014 speech, William Dudley, then president of the New York Fed, called attention to the “persistent overoptimism about the growth outlook by Federal Reserve officials and others in recent years” (Dudley 2014). A quantitative analysis by Lansing and Pyle (2015) confirms this basic idea. A study by Fernald et al. (2017) conjectures that forecasters’ overoptimistic predictions for the speed of the recovery might be due to their failure to account in real time for a slowdown in U.S. trend growth that, with the benefit of hindsight, appears to have started around 2006.
The accumulation of additional economic data in the decade since the end of the Great Recession now seems to confirm that U.S. trend growth did indeed slow down. For example, Fernald et al. (2017) point out that, despite the disappointing post-recession growth numbers, the pace of growth was nevertheless strong enough to bring about a rapid and faster-than-expected decline in the unemployment rate.
A complementary explanation for the overoptimistic recovery predictions, discussed in Lansing and Pyle (2015), emphasizes a persistent shortfall in aggregate demand. Specifically, forecasters might have overestimated the efficacy of monetary policy—either conventional or unconventional—in the aftermath of a so-called “balance sheet recession.” Recessions triggered by financial crises are typically preceded by sustained episodes of bubbly asset prices and debt-financed spending booms. When the bubble bursts, the resulting debt overhang forces borrowers to repair their balance sheets via reduced spending or default. Borrowers have too much debt, so monetary policy actions designed to encourage more borrowing by lowering interest rates are less effective. Balance sheet recessions are typically followed by sluggish recoveries in output. Some have argued that balance sheet recessions also scar potential output, leading to permanent output losses, such that real GDP never returns to its pre-crisis trend.
In addition, forecasters’ review of their own track records would likely have motivated a shift in methodology aimed at eliminating their prior optimistic bias. The theory of rational expectations predicts that economic agents will adjust their forecasts over time to eliminate any systematic bias towards optimism or pessimism. Consistent with this idea, the SEP central tendency midpoint forecasts for longer-run real GDP growth have ratcheted down gradually from about 2.7% in late 2009 to around 1.9% in 2016 where it has remained ever since.
Figure 4 shows the evolution of the SEP central tendency midpoint growth forecasts for the years 2017 through 2019. The pattern of forecast revisions is clearly different from the patterns observed in Figures 1 through 3. First, the forecasts for 2017 through 2019 all started out low—in the vicinity of 2% growth. These initial forecasts are close to the downwardly-revised SEP central tendency midpoint forecasts for longer-run real GDP growth. Second, the growth forecasts for 2017 through 2019 were all revised up over time—implying some conservatism in the initial forecasts. Indeed, the BEA’s first reported growth rates for these years all came in higher than the initial SEP forecasts. Third, the cumulative forecast revisions for these years are much smaller on average than in the past. The net upward forecast revision for the years 2017 through 2019 averaged +0.5 percentage points per year. Taken as a whole, these observations suggest that SEP participants adjusted their forecast methodology to eliminate the prior optimistic bias.
Figure 4
SEP central tendency midpoint forecasts: 2017 to 2019
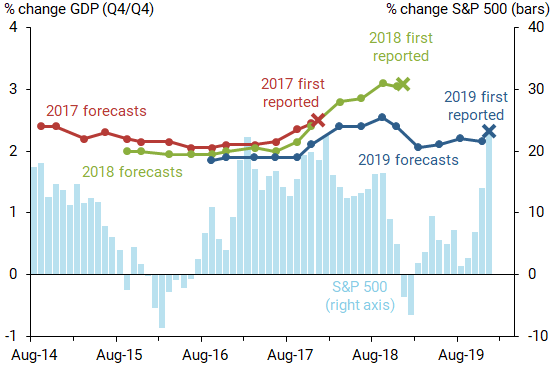
Notes: S&P 500 change is the 12-month percent change. Dots mark the SEP forecast release dates; X marks the BEA’s first reported Q4/Q4 real GDP growth rate for the year, typically released in January of the following year.
Source: Federal Open Market Committee Minutes, S&P 500.
Conclusion
A quip often attributed to baseball legend Yogi Berra states, “It’s tough to make predictions, especially about the future.” Our review of the SEP real GDP growth forecasts confirms the inherent difficulty of making accurate predictions about future economic activity. The good news is that the persistent overoptimism observed in the SEP growth forecasts for 2008 through 2016 was eliminated in the forecasts for 2017 through 2019. The not-so-good news is that the improved forecast performance appears to reflect an acknowledgment by SEP participants that the U.S. economy’s trend growth rate is now lower than in the years before the Great Recession.
Kevin J. Lansing is a research advisor in the Economic Research Department of the Federal Reserve Bank of San Francisco.
Winnie Yee is a research associate in the Economic Research Department of the Federal Reserve Bank of San Francisco.
References
Dudley, William C. 2014. “The Economic Outlook and Implications for Monetary Policy,” Remarks before the New York Association for Business Economics, New York City (May 20).
Fernald, John, Robert Hall, James Stock, and Mark W. Watson. 2017. “The Disappointing Recovery of Output after 2009.” Brookings Papers on Economic Activity, Spring, pp. 1–54.
Lansing, Kevin J., and Benjamin Pyle. 2015. “Persistent Overoptimism about Economic Growth” FRBSF Economic Letter 2015-03 (February 2).
Loungani, Prakash. 2001. “How Accurate are Private Sector Forecasts? Cross-Country Evidence from Consensus Forecasts of Output Growth.” International Journal of Forecasting 17(3), pp. 419–432.
Potter, Simon 2011. “The Failure to Forecast the Great Recession.” Liberty Street Economics (blog), FRB New York (November 25).
U.S. Financial Crisis Inquiry Commission. 2011. “Final Report on the Causes of the Financial and Economic Crisis in the United States.” Pursuant to Public Law 111-21 (January).
Opinions expressed in FRBSF Economic Letter do not necessarily reflect the views of the management of the Federal Reserve Bank of San Francisco or of the Board of Governors of the Federal Reserve System. This publication is edited by Anita Todd and Karen Barnes. Permission to reprint portions of articles or whole articles must be obtained in writing. Please send editorial comments and requests for reprint permission to research.library@sf.frb.org