
Many businesses had amassed high levels of debt, or leverage, before the COVID-19 pandemic. Out of precaution or necessity, firms increased their borrowing further after the onset. Although the shock to those firms’ value significantly increased their risk, measured by their distance-to-default, the default risk remains relatively small for most corporate debt. Nevertheless, the amount of outstanding liabilities among firms with elevated risk of insolvency is more than two times higher than at the peak of the global financial crisis.
The coronavirus disease 2019 (COVID-19) pandemic has been an unprecedented shock to the U.S. economy. Unemployment skyrocketed amid the largest contraction in economic activity on record. Although the country has deployed fiscal and monetary policies to counter the downturn and buffer the severe shock, how quickly the economy will recover remains highly uncertain and will depend on the path of the virus.
While financial firms were generally well capitalized and resilient before the onset of the health crisis, many other businesses entered the pandemic with very high levels of debt, or leverage. Against this backdrop, the pandemic has lowered corporate profits sharply. Credit availability turned scarce as lenders tightened underwriting standards. The ability of businesses to survive the crisis and the implications for financial stability has received heightened attention.
In this Economic Letter, we examine the impact of the COVID-19 pandemic on the insolvency risk of nonfinancial firms in the United States using high-frequency market data to estimate their distance-to-default. Our findings show that their insolvency risk has risen significantly since the pandemic and is comparable to the peak of the 2008 global financial crisis in terms of their proximity to insolvency. Moreover, businesses have almost doubled the amount of money borrowed since 2008, and the ratio of nonfinancial business debt to the country’s gross domestic product is at a 40-year high. Thus, for a given level of insolvency risk, the amount of exposure is higher now than during the financial crisis. Among firms that are particularly close to insolvency according to the distance-to-default metric, the amount of their debt now is more than two times the amount for this same risk group during the global financial crisis.
Nonfinancial business borrowing
U.S. business debt has been increasing over many years. The ratio of the book value of debt to total assets for all publicly traded nonfinancial firms was at its highest level in 20 years at the beginning of 2020. For highly leveraged public firms, this indicator is close to a record high (Board of Governors 2020).
When the coronavirus crisis hit the country, businesses rushed to draw down their lines of credit at banks. This was exacerbated in part when the commercial paper market that provides short-term funding to businesses froze up. The Federal Reserve established the Commercial Paper Funding Facility, which quickly restored liquidity in the commercial paper market, making it easier for businesses to tap short-term funding from the market. Corporate bond issuance initially dried up with the onset of the pandemic but resumed soon after the Fed launched the Primary Market Corporate Credit Facility. The Fed later launched the Secondary Market Corporate Credit Facility to provide a liquidity backstop to the corporate bond market, further enhancing its smooth functioning. Net issuance of corporate bonds has been robust since then, especially among investment-grade firms. As firms ramped up their borrowing during the pandemic, mostly to increase their cash holdings for precautionary purposes, nonfinancial business leverage has accelerated even further from its already very high levels.
Figure 1 depicts the total liabilities of nonfinancial firms, grouped by leverage ratio buckets for 2008, 2019, and 2020 as of September. The leverage ratio is the ratio of the book value of total liabilities to the sum of book value liabilities and market value equities. Thus, the higher the percentage of the bucket, the higher the borrowing for those companies. Total liabilities in all leverage buckets except the 90-100% bucket are higher in 2020 than in 2008, reflecting the trend of higher nonfinancial business leverage since the financial crisis. Total liabilities in 2020 are 1.7 times the level in 2008 after adjusting for inflation.
Figure 1
Total business liabilities by leverage ratio buckets
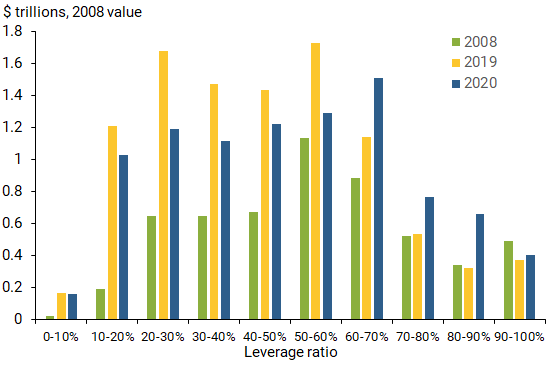
Since the pandemic, total liabilities increased for each of the four highest leverage buckets. This reflects rising leverage among firms in general, as well as the fact that already highly leveraged firms further increased their borrowing.
Insolvency risk during the pandemic
Despite the unprecedented fiscal stimulus from the U.S. government and credit market interventions by the Federal Reserve, many businesses have failed. Chapter 11 bankruptcy filings are running at their fastest pace since 2013. The number of companies that have defaulted on their debt so far this year has surpassed the total for all of 2019 and is on course to be the highest since 2009.
A large volume of outstanding corporate bonds among these businesses was downgraded in March 2020. This included an elevated volume of fallen angels—bonds that were downgraded from investment grade to below investment grade. The number of companies at the lowest rungs of the credit ratings ladder, that is, one notch above default, has almost doubled since the start of this year.
In this challenging environment, how close are businesses to insolvency? We address this question by estimating the distance-to-default of each nonfinancial corporate firm in the United States. We use high-frequency market data, which reflect market expectations of future government assistance due to the pandemic, to ensure our distance-to-default measure is both timely and forward looking. Moreover, this method allows us to compute the distance-to-default for firms that do not issue public debt and are not rated by credit rating agencies.
Merton (1974) applies the Black-Scholes (1973) option pricing model to the valuation of equity, providing crucial insights into the insolvency risk of a firm. Under this framework, when a company’s debt matures, shareholders can choose between paying off debtholders to retain control of the firm or defaulting on the debt and giving the debtholders the right to control the firm’s assets. In theory, when the value of the firm exceeds the debt obligation, the shareholders pay off the debtholders and keep the residual value of the firm. When the market value of the firm falls below the liability value—in other words, is insolvent—shareholders relinquish their right to control the firm’s assets and walk away with nothing. The distance-to-default measures how close a firm is to this insolvency condition, taking into consideration the market value of the firm, the face value of liabilities, and the firm’s asset volatility. Thus, this measure provides a useful real-time indicator of insolvency risk.
In this Letter, we measure the market value of the firm by the market value of equities and the book value of debts. We estimate the firm’s asset volatility using the historical daily volatility of the firm’s equity over the past 252 trading days. A few caveats are in order: As in other market-based indicators, we assume market prices accurately reflect the true economic value of the underlying assets. Future volatility may be higher or lower than past volatility and is likely to follow the evolution of the pandemic. The insolvency condition in our model is technical in nature and, as such, does not automatically trigger default.
We express the distance-to-default by the number of standard deviations a firm’s value is away from the insolvency boundary. This means that a lower distance-to-default corresponds to higher insolvency risk. Figure 2 shows the cross-firm distributions of distance-to-default for all publicly traded nonfinancial firms at the end of 2008 and 2019; for 2020, the figure reflects market data as of September 24 and total liabilities as of the end of the second quarter. Since the pandemic, the distribution has shifted to the left, indicating that publicly traded nonfinancial firms as a whole are getting closer to the insolvency threshold. As a result of lower equity value and heightened volatility, the median distance-to-default declined from 4.28 in 2019 to 2.20 in September 2020, and the 25th percentile of the distribution dropped from 2.48 in 2019 to 1.18 now. The current distribution of insolvency risk is comparable in many ways to that of the 2008 financial crisis. The 2008 median of 1.96 and 25th percentile of 1.14 were only slightly lower than they are now. In addition, the current fraction of firms at the insolvency boundary is very similar to what it was in 2008.
Figure 2
Distribution of businesses’ distance-to-default
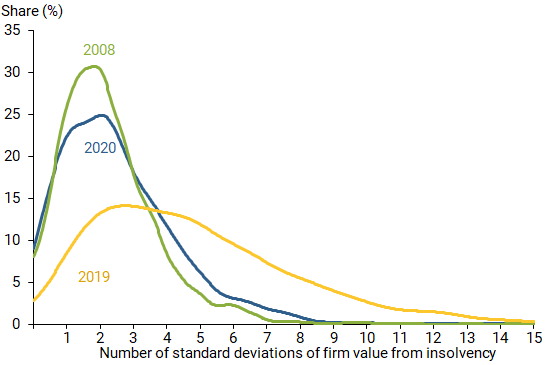
Source: Bloomberg, Compustat, and Federal Reserve Board of Governors.
Insolvency risk and vulnerability
For monitoring financial stability, the left end of the distribution of companies by distance-to-default is of particular interest because these firms are closer to insolvency than the other firms. To group firms that have a higher probability of becoming insolvent, we compute the probability of insolvency for each firm by evaluating the likelihood that their asset value will fall below their liability value at their current distance-to-default level. We then group the firms into bins of 10% increments based on their probability of insolvency.
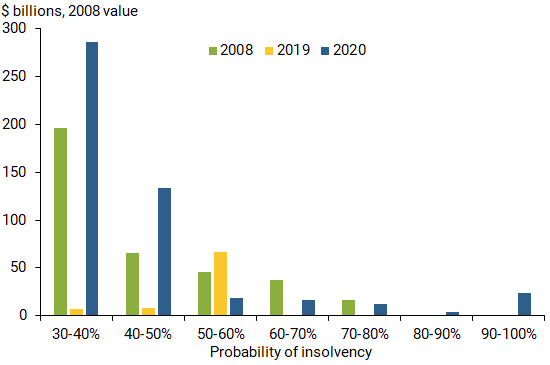
Currently, 95% of total outstanding corporate debt has been incurred by firms with less than 30% probability of insolvency, despite the historically high levels of nonfinancial business leverage. This suggests that the vast majority of corporate debt does not appear to be at risk of default in the near term. Nevertheless, the right tail of a default probability distribution—that is, those companies with the highest probabilities of becoming insolvent—looks different compared with that of 2008. Figure 3 shows the amount of total liabilities, grouped by probability of insolvency buckets that are greater than 30%. Total liabilities with greater than 70% probability of insolvency currently stand at $40.5 billion, valued in 2008 dollars. This is a substantial increase over the past, more than two times the 2008 level.
Figure 3
Total business liabilities by insolvency probability buckets
Conclusion
Based on our distance-to-default analysis, the COVID-19 shock has significantly increased the insolvency risk for nonfinancial businesses, despite the massive fiscal stimulus and a number of Federal Reserve credit facilities. While the insolvency risk looks broadly similar to the peak of the global financial crisis, businesses entered the pandemic already having very high leverage, and they have since further increased those debt levels. Currently, the vast majority of outstanding corporate debts are incurred by firms with a low probability of insolvency, despite the historically high business leverage. Nevertheless, those firms with elevated risk of insolvency account for a sizable amount of outstanding liabilities totaling $40.5 billion in 2008 dollars, which is more than two times higher than at the peak of the global financial crisis.
Sophia Friesenhahn is a research associate in the Economic Research Department of the Federal Reserve Bank of San Francisco.
Simon Kwan is a senior research advisor in the Economic Research Department of the Federal Reserve Bank of San Francisco.
References
Black, Fischer, and Myron Scholes. 1973. “The Pricing of Options and Corporate Liabilities.” Journal of Political Economy 81(3), pp. 637–654.
Board of Governors of the Federal Reserve System. 2020. Financial Stability Report. Washington, DC: Board of Governors, May.
Merton, Robert C. 1974. “On the Pricing of Corporate Debt: The Risk Structure of Interest Rates.” Journal of Finance 29(2), pp. 449–470.
Opinions expressed in FRBSF Economic Letter do not necessarily reflect the views of the management of the Federal Reserve Bank of San Francisco or of the Board of Governors of the Federal Reserve System. This publication is edited by Anita Todd and Karen Barnes. Permission to reprint portions of articles or whole articles must be obtained in writing. Please send editorial comments and requests for reprint permission to research.library@sf.frb.org