

U.S. labor productivity has grown quickly during the pandemic compared with the past decade. However, this rapid pace is unlikely to be sustained. Similar to the Great Recession, the primary reasons for strong productivity growth now are cyclical effects that are likely to unwind as the economy continues to recover. For example, the number of workers has fallen, so capital per worker has risen—raising labor productivity in the short term. What effect the pandemic itself might have on productivity remains uncertain.
In the 15 years before the COVID-19 pandemic, U.S. labor productivity—output per hour worked—grew relatively slowly. This slow pace of productivity growth was a key reason for disappointing GDP growth. It was also a key reason why, on the eve of the pandemic, future growth of the economy was widely expected to remain modest (Fernald and Li 2021).
Since the pandemic started in early 2020, however, labor productivity has risen rapidly. This Letter puts the 2020–21 experience in context by analyzing recent productivity trends for the U.S. business sector. Our growth-accounting approach highlights that the exceptional recent boost to productivity primarily reflects cyclical effects that are unlikely to persist and that could even reverse. While there is a lot of speculation about how the pandemic itself will affect productivity, it is too early to reliably assess how much those effects will matter in the long run.
Recent slow labor productivity growth
To examine trends over the past half century, Figure 1 shows growth in business-sector labor productivity, or output per hour, for selected periods. Colored sections of the bars show the components that contributed to productivity growth. The components sum to the average annual pace of productivity growth during each period. Several periods are relatively long—a decade or two—and correspond to “growth regimes” identified by Fernald (2015). Several others, including 2020–21, correspond to only one or two years that have distinct changes in the composition or pace of growth.
Figure 1
Contributions to growth in U.S. business-sector output per hour
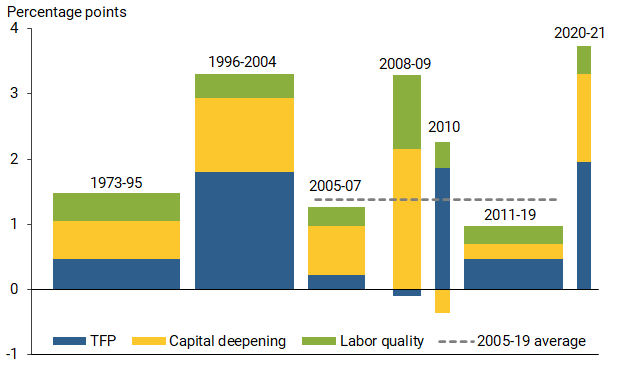
Fernald (2014). Business sector growth rates are all Q4/Q4, except for first bar, which starts in 1973:Q2 and last bar, which ends in 2021:Q2. Dashed horizontal line shows average labor productivity growth from 2004:Q4 to 2019:Q4. Capital deepening reflects contribution of capital relative to quality-adjusted hours. Total factor productivity (TFP) is measured as a residual.
Productivity growth has averaged 1.8% per year since 1973. The first longer period in the figure averaged somewhat lower. Productivity then accelerated to a 3¼% pace in the 1996–2004 period, reflecting the gains from information and communications technology, including the introduction of the internet (Fernald 2015). However, from 2005 to 2019, productivity growth slowed to only around 1½% per year, shown by the dashed gray line. Productivity fell below that average from 2011 to 2019, growing less than 1% per year.
The three components of productivity growth vary in importance over time. The first is labor quality (green sections), which reflects growth in worker skills arising from education and experience. For example, in 1950, only 34% of Americans age 25 and older had graduated from high school and only 6% had graduated from college. Today, 90% have graduated from high school and 34% have graduated from college. More education and job-specific experience increases the skills and abilities of workers, raising their productivity levels. On average since 1973, rising education and experience have contributed about 0.4 percentage points per year to productivity growth.
The second component, capital deepening (gold sections), arises from growth in the equipment, structures, and intellectual capital that workers use. When companies invest in new plants, purchase new equipment, or automate a process, each worker can apply more or better “tools,” or capital, to the hours they work. As a result, they can produce more. This component explains 0.7 percentage points on average to productivity growth since 1973.
The final component (blue sections) is a broad, indirect measure of innovation known as total factor productivity (TFP). TFP is the residual portion of labor productivity growth that cannot be explained by labor quality or capital deepening. In the long run, TFP captures productivity benefits from many sources. These include formal and informal research and development, improvements in management practices, and reallocation as high-productivity businesses expand while low-productivity businesses contract or exit. Since 1973, TFP growth on average explains the final 0.7 percentage points of average labor productivity growth.
What happens to productivity during and after recessions?
Even during the generally slower-growth period since 2004, the narrow bars show some short-lived spikes in output per hour. These spikes correspond to the Great Recession (2008–09) and its early aftermath (2010), as well as the pandemic period from 2020 through the second quarter of 2021. Productivity growth since the beginning of 2020 has been about 3½%, high by historical standards and much higher than the 2010–19 rate—even as hours worked have, on average, fallen over this period.
These spikes, including during the pandemic, reflect a general pattern in recent decades: productivity rises when economic activity contracts (Fernald and Wang 2016). Thus, the recent movements do not necessarily reflect unusual efficiency gains from the pandemic.
The productivity acceleration during the pandemic can be explained primarily by cyclical increases in labor quality and capital deepening. First, the downturn led to strong growth in labor quality, (green bar). The contractions in output and employment were particularly intense in high-contact service sectors, such as restaurants and hotels. These service sectors tend to employ workers who are younger and less educated than the average. Hence, as these sectors contracted, the average experience and education of the people who continued to work rose. This effect was particularly noticeable in the first half of 2020 and has already begun to reverse since that time.
Second, the plunge in employment during the pandemic also caused capital deepening (gold bar) to rise rapidly. While available capital changed little, there were fewer workers, so each worker had more capital to work with. This reflects, in part, that industries that shrank the most in the pandemic, such as leisure and hospitality, tend to be less capital intensive than the average.
The movements in labor quality and capital deepening—and thus in overall productivity—are not unusual in recessions. A similar surge occurred in 2008–09, during the Great Recession: employment and hours worked fell sharply, so the workers who kept their jobs had more capital to work with. And younger, less-educated workers disproportionately lost jobs, leading to a sharp rise in labor quality for those who kept working.
What about TFP (blue bar), which shows comparatively modest movements overall during the pandemic? In the long run, innovation that shows up in TFP is the source of sustainable growth in productivity. But in the short run, business-cycle factors are typically very important. During the pandemic, TFP, like the other components, shows fairly typical cyclical movements.
Indeed, the seemingly healthy pandemic growth in TFP averages across some extreme fluctuations. During the first half of 2020, as the economy contracted, TFP plunged. Starting in the second half of 2020, as the economy was recovering, TFP rebounded strongly.
This pattern is typical of recessions, where TFP regularly ebbs and flows for reasons that have nothing to do with the pace of innovation. Indeed, in every postwar recession, measured TFP growth was negative for a time, as in 2008–09 and in the first half of 2020. An important, intuitive reason is known as “labor hoarding.” When the economy goes into recession and demand falls temporarily, businesses want to retain some of their existing workforce—even if they could meet demand with fewer workers—to avoid losing workers with specialized skills and experience that will be needed when the economy recovers. Labor hoarding tends to reduce measured TFP, since output falls without a commensurate fall in measured inputs. When demand recovers, those businesses have idle workers and excess capacity and can quickly ramp up production without substantial hiring or investment. Hence, measured TFP surges, as shown for 2010.
It is possible, though challenging, to adjust directly for the measurement effects of the business cycle on TFP. The Fernald (2014) TFP database includes such an adjustment. Over the longer periods in Figure 1, the adjusted measure closely matches TFP growth. But over short periods, the adjusted measure often looks different. Over 2020–21, the adjusted measure of TFP grew only modestly. The business-cycle adjustment is subject to considerable uncertainty—which is why we do not emphasize it in Figure 1. However, the adjusted measure is consistent with the view that underlying TFP growth has not been exceptional.
What do the data imply for future productivity?
Following strong gains in 2008–09 and 2010, labor productivity weakened significantly in 2011–19. As the figure shows, capital deepening was particularly weak—undoing its recession-induced spike. The reason is intuitive. Businesses came out of the recession with a lot of capital relative to labor, so they could meet demand primarily by hiring rather than by investing in new capital. In addition, since many of the people they hired had lower skills than current workers, labor quality growth was somewhat subdued. A similar pattern seems likely following the pandemic. That is, the strong, cyclically induced growth in capital deepening and labor quality that drove the productivity spike in 2020–21 is likely to unwind.
The wild card is TFP growth, which is, in principle, the sustainable source of productivity growth. The particular characteristics of the pandemic might, on their own, affect TFP, though the direction is unclear. On the one hand, many businesses report expecting that short- and medium-term disruptions and cost increases—such as spending more on cleaning and other health measures—will make them less efficient, meaning TFP will be lower than it otherwise would be (Bloom et al. 2020). On the other hand, some workers are more productive at home than in the office (Barrero, Bloom, and Davis 2021), and businesses have learned new ways of operating that may offer ongoing efficiencies, such as remote digital meetings as a substitute for costly business travel. On balance, Fernald and Li (2021) expect these and other effects to be relatively modest. But there is considerable uncertainty.
Conclusion
Productivity growth has been very strong during the pandemic. This does not, however, indicate that changes induced by the pandemic itself—such as the shift to remote work and online shopping—have caused a persistent break from the earlier slow productivity trend. Growth accounting indicates that the major sources of the recent productivity strength are cyclical and are unlikely to be sustained. In particular, the decline in employment boosted capital deepening; the experience after the Great Recession suggests that this temporary boost is likely to reverse. In addition, because the employment decline was more pronounced among workers with lower education and less experience, the average labor quality of those who kept their jobs rose. This effect has already started to reverse and may reverse further as lower-skilled workers increasingly return to work.
Of course, the pandemic itself could influence the pace of TFP growth. However, it is premature to assess any such effects from the aggregate productivity statistics.
John Fernald is a senior research advisor in the Economic Research Department of the Federal Reserve Bank of San Francisco.
Huiyu Li is a senior economist in the Economic Research Department of the Federal Reserve Bank of San Francisco.
Mitchell Ochse is an economist in the Bureau of Labor Statistics.
References
Barrero, Jose M., Nicolas Bloom, and Steve J. Davis. 2021. “Why Working from Home Will Stick.” NBER Working Paper 29731, April.
Bloom, Nicolas, Philip Bunn, Paul Mizen, Pawel Smietanka and Greg Thwaites. 2020. “The Impact of Covid-19 on Productivity.” NBER Working Paper 28233, December.
Fernald, John. 2014. “A Quarterly, Utilization-Adjusted Series on Total Factor Productivity.” FRB San Francisco Working Paper 2012-19.
Fernald, John. 2015. “Productivity and Potential Output before, during, and after the Great Recession.” NBER Macroeconomics Annual 29(1), pp. 1–51.
Fernald, John, and Huiyu Li. 2021. “The Impact of COVID on Potential Output.” FRB San Francisco Working Paper 2021-09.
Fernald, John, and Christina Wang. 2016. “Why Has the Cyclicality of Productivity Changed? What Does It Mean?” Annual Reviews of Economics 8, pp. 465–496.
Opinions expressed in FRBSF Economic Letter do not necessarily reflect the views of the management of the Federal Reserve Bank of San Francisco or of the Board of Governors of the Federal Reserve System. This publication is edited by Anita Todd and Karen Barnes. Permission to reprint portions of articles or whole articles must be obtained in writing. Please send editorial comments and requests for reprint permission to research.library@sf.frb.org