
The link between changes in U.S. inflation and the output gap has weakened in recent decades. Over the same time, a positive link between the level of inflation and the output gap has emerged, reminiscent of the original 1958 version of the Phillips curve. This development is important because it indicates that structural changes in the economy have not eliminated the inflationary pressure of gap variables. Improved anchoring of people’s expectations for inflation, which makes the expected inflation term in the Phillips curve more stable, can account for both observations.
The Phillips curve is a key mathematical relationship that many economists use to explain the behavior of inflation. The relationship presumes that inflation is partly driven by gap variables, which measure how much economic activity deviates from its potential, that is, the level of activity consistent with full use of economic resources. Gap variables can include the percent deviation of real GDP from potential GDP, known as the output gap, or the deviation of the actual unemployment rate from its natural rate, known as the unemployment gap. The original Phillips curve dates back to Phillips (1958), who documented a link between wage inflation and unemployment in the United Kingdom from 1861 to 1957. In the modern Phillips curve formulation, inflation depends not only on gap variables but also on expected inflation—the inflation rate that people expect to prevail in the near future. All else being equal, either a larger output gap, implying faster than potential GDP growth, or a more negative unemployment gap, implying a tighter labor market, would predict higher inflation over the near term. But for any given value of the gap variable, a higher value of expected inflation would also predict higher inflation over the near term.
Numerous studies have found that the link between changes in U.S. inflation and the output gap has weakened in recent decades. Over roughly the same period, a positive link between the level of U.S. inflation and the output gap has emerged, reminiscent of the original 1958 version of the Phillips curve. This Economic Letter examines these developments and argues that improved anchoring of expected inflation can account for both observations. With improved anchoring, the expected inflation term in the Phillips curve becomes more stable. Consequently, movements in the level of inflation are driven less by expected inflation and more by the output gap. Stable expected inflation also means that changes in inflation are no longer driven by the output gap itself, but rather by changes in the output gap.
Shifting gap coefficients in Phillips curve regressions
Numerous studies have examined the usefulness of the Phillips curve for explaining inflation behavior (see Lansing 2019 for a review). A typical statistical exercise regresses the change in inflation over the past four quarters on a constant term and the value of the output gap. A typical finding is that the estimated coefficient on the output gap has diminished over time.
To illustrate the idea of a weaker link between changes in inflation and the output gap, Figure 1 plots the estimated coefficient on the output gap from a series of rolling regressions, where each regression covers a 20-year window of data. As the window shifts forward in time, older data is dropped while more recent data is added. The initial regression uses data from the first quarter of 1960 through the fourth quarter of 1979. For each 20-year window, we regress the change in the inflation rate over the past four quarters on a constant term and the value of the output gap. For the inflation rate, we use the percentage change in the headline consumer price index (CPI) over the past four quarters. We measure the output gap using the real potential GDP series constructed by the Congressional Budget Office. We obtain similar results using alternative measures of inflation or alternative gap variables.
Figure 1
Weaker link between inflation changes and output gap
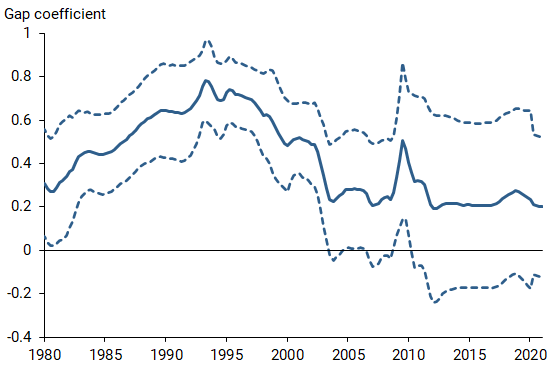
Notes: Solid blue line shows the estimated coefficient from a regression of the 4-quarter change in CPI inflation on the output gap, based on 20-year rolling sample periods. Dashed lines represent 95% confidence intervals.
The estimated coefficient on the output gap using the full sample of data from 1960 through the first quarter of 2021 is positive and statistically significant according to conventional 95% confidence intervals. However, the rolling regressions show that the estimated gap coefficient declines over time and is rarely statistically significant for 20-year sample periods ending after mid-2003. Along similar lines, former Fed Chair Janet Yellen (2019) remarked, “The slope of the Phillips curve—a measure of the responsiveness of inflation to [economic] slack—has diminished very significantly since the 1960s.”
Various hypotheses have been proposed to explain the declining gap coefficient in Figure 1. These include (1) structural changes in the economy that have reduced the inflationary pressure of gap variables, (2) the successful stabilizing effects of monetary policy in response to supply shocks that push inflation and the output gap in opposite directions, creating the statistical illusion of a declining gap coefficient, (3) vigilant monetary policy that has served to anchor people’s inflation expectations, and hence inflation itself, to a value near 2%, (4) demographic shifts or other slow-moving forces that have contributed to mismeasurement of the gap variable, and (5) the existence of a nonlinear relationship between inflation and the gap variable, causing the gap coefficient to become smaller in magnitude when inflation is low or less volatile.
In Jørgensen and Lansing (2021), we point out that an alternative Phillips curve regression can help shed light on the plausibility of some of these hypotheses. Specifically, we regress the level of inflation—rather than the change in inflation—on a constant term and the value of the output gap. The form of this regression is reminiscent of the original 1958 version of the Phillips curve, which did not include an explicit measure of expected inflation on the right side of the equation. However, the constant term on the right side of the regression equation can capture expected inflation when peoples’ inflation expectations remain closely anchored to the Fed’s 2% inflation target.
Figure 2 plots the estimated gap coefficient for the alternative Phillips curve regression, again from a series of 20-year rolling regressions. The estimated gap coefficient is rarely statistically significant for 20-year sample periods ending before the third quarter of 2012. But for subsequent periods, the estimated gap coefficient remains positive and statistically significant. The Phillips curve appears to have shifted from an “accelerationist” curve in which economic activity affects the change in inflation to one in which activity affects the level of inflation, an observation noted previously by Blanchard (2016).
Figure 2
Stronger link between inflation levels and output gap
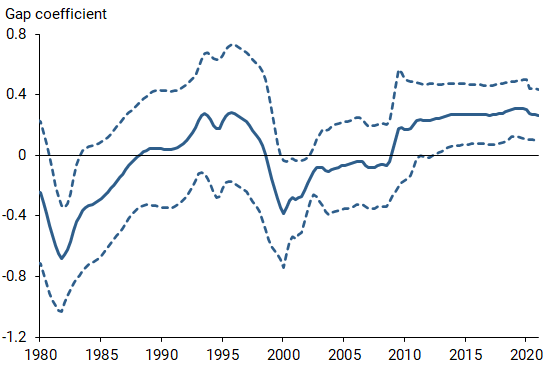
Notes: Solid blue line shows the estimated coefficient from a regression of CPI inflation on the output gap, based on 20-year rolling sample periods. Dashed lines represent 95% confidence intervals.
The emergence of a positive and statistically significant link between the level of inflation and the output gap in recent decades is important because it tells us that structural changes in the economy have not eliminated the inflationary pressure of gap variables. It also tells us that stabilizing monetary policy in response to supply shocks has not obscured the statistical relationship between inflation and the output gap. On the contrary, the relationship has become stronger in recent decades, as shown by Figure 2.
Improved anchoring as an explanation for the shifting gap coefficients
Bernanke (2007) defines the term “anchored” to mean that expected inflation is “relatively insensitive to incoming data.” Put another way, people’s forecasts of future inflation will tend to remain close to the Fed’s 2% inflation target even if they observe inflation rates that are higher or lower than 2%.
Figure 3 provides evidence that a measure of one-year-ahead expected CPI inflation from the Survey of Professional Forecasters has become less sensitive to incoming data on inflation itself. A regression of one-year-ahead expected CPI inflation on the trailing four-quarter CPI inflation rate yields a coefficient on CPI inflation of 0.56 for the sample period from the third quarter of 1981 to the end of 1998. The same regression yields a much smaller coefficient of 0.16 for the sample period from 1999 through the first quarter of 2021. Other measures of expected inflation derived from surveys or from financial markets exhibit similar patterns.
Figure 3
Expected inflation has become less sensitive to inflation
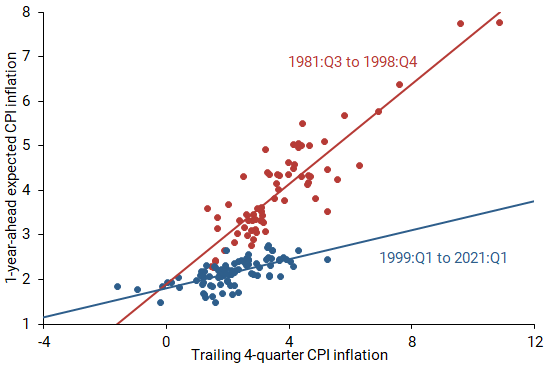
Note: The slope of each line represents the estimated coefficient from a regression of the 1-year-ahead expected CPI inflation rate on CPI inflation.
In Jørgensen and Lansing (2021), we develop a macroeconomic model in which the improved anchoring of expected inflation is achieved by vigilant monetary policy that keeps inflation close to target. Improved anchoring, in turn, can account for both of the shifting coefficient patterns in Figures 1 and 2. In the model, households and businesses use what they know from past inflation changes to distinguish between persistent and transitory shocks to inflation. If lax monetary policy allows inflation to drift away from target often, then households and businesses will come to view inflation shocks as persistent, resulting in weak anchoring of expected inflation. In this case, expected inflation, which appears on the right side of the Phillips curve equation, can be approximated by lagged inflation because recent inflation influences people’s forecasts about future inflation. As a result, the change in inflation—defined as inflation minus lagged inflation—is positively linked to the value of the output gap. But if vigilant monetary policy keeps inflation close to target, then households and businesses will come to view inflation shocks as transitory, resulting in strong anchoring of expected inflation. In this case, expected inflation can be approximated by a constant value of 2%. As a result, the level of inflation on the left side of the Phillips curve equation becomes positively linked to the value of the output gap on the right side. According to the model, a shift in expected inflation from an environment of weak anchoring to one of strong anchoring can account for the declining gap coefficient in Figure 1 and the emergence of a positive gap coefficient in Figure 2.
As a final piece of evidence in support of the improved anchoring hypothesis, we can examine a third Phillips curve regression. Recall that under strong anchoring, the level of inflation depends positively on the value of the output gap. An implication of strong anchoring is that changes in inflation will depend positively on changes in the value of the output gap, not on the value of the output gap itself. Figure 4 plots the results when we regress the change in inflation over the past four quarters on a constant term and the change in the output gap over the past four quarters, again using a series of 20-year rolling regressions. The link between changes in inflation and changes in the output gap has strengthened in recent decades, consistent with a shift towards stronger anchoring of expected inflation.
Figure 4
Stronger link between inflation changes, output gap changes
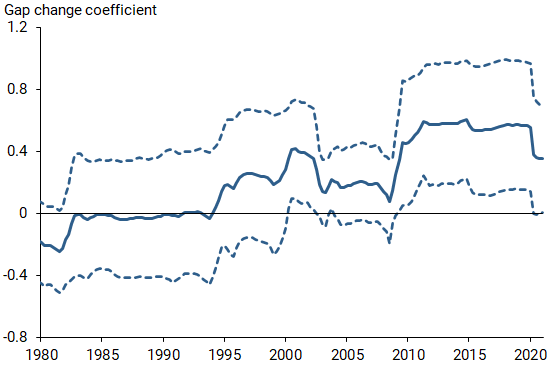
Notes: Solid blue line shows the estimated coefficient from a regression of the 4-quarter change in CPI inflation on the 4-quarter change in the output gap, based on 20-year rolling sample periods. Dashed lines represent 95% confidence intervals.
Conclusion
A link between economic activity and inflation is a key element of the modern Phillips curve. Inflation expectations have become more firmly anchored in recent decades, as shown by the reduced sensitivity of expected inflation to incoming data on inflation itself. Improved anchoring can account for numerous features of U.S. inflation behavior, including the emergence of a positive and statistically significant link between the level of inflation and the output gap. This development is important because it tells us that structural changes in the economy have not eliminated the inflationary pressure of gap variables. The underlying relationship between inflation, expected inflation, and economic activity, as embodied in the modern Phillips curve, appears alive and well.
Peter Lihn Jørgensen is an assistant professor in the Department of Economics at Copenhagen Business School.
Kevin J. Lansing is a senior research advisor in the Economic Research Department of the Federal Reserve Bank of San Francisco.
References
Bernanke, Ben. 2007. “Inflation Expectations and Inflation Forecasting.” Speech at the Monetary Economics Workshop of the NBER Summer Institute, Cambridge, MA (July 10).
Blanchard, Olivier. 2016. “The Phillips Curve: Back to the ’60s?” American Economic Review: Papers and Proceedings 106(5), pp. 31–34.
Jørgensen, Peter Lihn, and Kevin J. Lansing. 2021. “Anchored Inflation Expectations and the Slope of the Phillips Curve.” FRB San Francisco Working Paper 2019-27.
Lansing, Kevin J. 2019. “Improving the Phillips Curve with an Interaction Variable.” FRBSF Economic Letter 2019-13 (May 6).
Phillips, A. William. 1958. “The Relation between Unemployment and the Rate of Change of Money Wage Rates in the United Kingdom, 1861–1957.” Economica 25, pp. 283–299.
Yellen, Janet. 2019. “What’s (Not) Up With Inflation?” Remarks at conference hosted by the Hutchins Center on Fiscal and Monetary Policy at the Brookings Institution, Washington, DC (October 3).
Opinions expressed in FRBSF Economic Letter do not necessarily reflect the views of the management of the Federal Reserve Bank of San Francisco or of the Board of Governors of the Federal Reserve System. This publication is edited by Anita Todd and Karen Barnes. Permission to reprint portions of articles or whole articles must be obtained in writing. Please send editorial comments and requests for reprint permission to research.library@sf.frb.org