
A key to designing fiscal policy is understanding how government purchases affect economic output overall. Research suggests that expanding government spending is not very effective at stimulating an economy in normal times. However, in deep downturns when monetary policy is constrained at the zero lower bound, public spending is more potent and can become an effective way to escape a recession.
The health crisis brought on by the COVID-19 pandemic has prompted authorities to force the temporary shutdown of many businesses. Beyond the immediate health concerns, a central worry is the possibility that the temporary freeze in business production has spillover effects that could lower overall demand in the economy and turn the deep downturn into a persistent slump. To prevent such spillover effects, fiscal and monetary authorities around the world have taken extraordinary measures. Early in the pandemic, the goal was to cushion the economic blow imposed by mandated shutdowns. Once there is better control of the pandemic, the debate will shift to ways to ensure a rapid rebound of the economy and avoid long-term damages to economic potential.
In this context, a popular fiscal tool is to use government purchases of goods and services to stimulate aggregate demand. For instance, about one-third of the U.S. fiscal package enacted in response to the 2008–09 recession was targeted to boost higher public consumption (Wilson 2020).
A lot of research has estimated the size of the U.S. government spending multiplier—the change in overall economic output caused by a $1 change in government spending. A multiplier above 1 indicates that public purchases can be a powerful way to stimulate the economy out of a recession. Unfortunately, the range of estimates for the spending multiplier remains wide, between 0.5 and 2.0. In part, the size of the multiplier may vary depending on the type of government spending. For instance, Leduc and Wilson (2012) estimate that multipliers are large for government investment in infrastructure.
In our recent work (Barnichon, Debortoli, and Matthes 2020), we also show that the direction of the fiscal intervention—an expansion or a contraction—is an important yet overlooked determinant of the spending multiplier. We find that the multiplier associated with a decrease in public spending is large and above 1, but the multiplier associated with an increase in public spending is substantially below 1. In other words, government spending may not be a cost-effective way to stimulate an economy in normal times. However, in the current situation when the federal funds rate is constrained by the zero lower bound, the expansionary multiplier is likely to be larger, thus making public spending a more potent prescription to help boost the economy.
Detecting asymmetry in the fiscal multiplier
To estimate the size of the spending multiplier, we build on a recent study by Ramey and Zubairy (2018). Drawing on more than 100 years of U.S. data, the authors identified historical changes in the path of public spending related to wars or geopolitical events. Since these changes are unrelated to the business cycle, they can be used as natural experiments to infer how changes in public spending affect economic activity. We use these spending changes to test whether fiscal expansions have the same size of effects in the opposite direction as fiscal contractions.
Using data between the late 1800s and 2014—thus excluding the current downturn—we find strong evidence for asymmetric effects of public spending, as shown in Figure 1. The contractionary multiplier associated with a $1 decrease in government spending is about 1.4, substantially larger than the expansionary multiplier following a $1 increase in public spending, which is only 0.8.
Figure 1
Asymmetric government-spending multipliers, 1890–2014
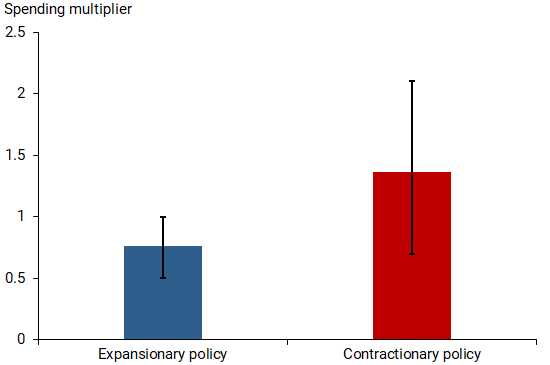
Note: Black error bars reflect 90% confidence intervals.
Source: Barnichon, Debortoli, and Matthes (2020).
Accounting for asymmetry in the spending multiplier
To draw possible lessons for fiscal policymaking, we build an economic model that can explain these empirical results. Figure 2 shows how inflation and output are determined in equilibrium in our model economy. The downward sloping blue curve is the aggregate demand (AD) curve, which captures the fact that a lower inflation rate allows the central bank to set a lower interest rate, which then leads to a higher level of output. The upward sloping red curve is the aggregate supply (AS) curve, which captures how a higher output level tightens the labor market and leads to upward pressures in wages and prices. The economy’s equilibrium is point A, when aggregate demand equals aggregate supply.
The key feature of our model is a convex AS curve, which becomes steeper as output increases. This differs from the standard textbook macroeconomic model, which defines aggregate supply as a straight line that rises at a steady rate as economic output increases. One possible rationale for using a convex supply curve is so-called downward nominal wage rigidity: many economic studies have documented that nominal wages frequently go up or stay flat but rarely go down (see, for example, Daly and Hobijn 2014). Because employers are unable to reduce wages during an economic downturn, they lay off workers, which exacerbates the initial economic shock. This can generate a convex AS curve because it means that wages and prices do not decline or decline less when output is low. This can be seen by the relative flatness of the AS curve at point C in Figure 2.
As Figure 2 illustrates, an increase in government purchases shifts the AD curve outward (up and to the right), which leads to a new equilibrium, going from point A to point B. A decrease in government purchases shifts the AD curve inward (down and to the left) and the equilibrium would move from point A to point C. The size of the fiscal multiplier is given by the magnitude of the change in output going from the old equilibrium to the new equilibrium. As the figure shows, the convexity of the AS curve results in the output change being smaller when the AD curve shifts outward than when it shifts inward. If the AS curve were a straight line, the output change would be the same in absolute value, regardless of which direction the AD curve shifts.
Figure 2
Effects of changes in public spending in model economy
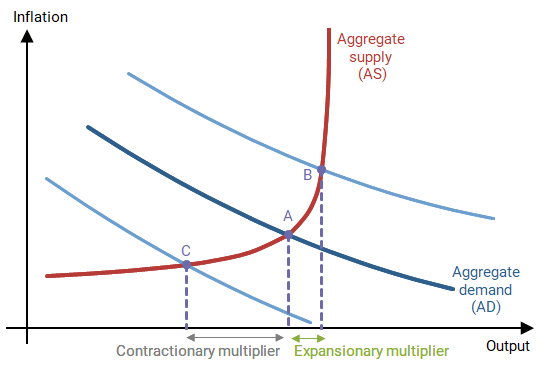
This discussion demonstrates that a convex AS curve can lead to an asymmetric multiplier, in that an increase in public spending has a comparatively smaller effect on the economy than a decrease in public spending, as illustrated in Figure 2 and consistent with our empirical findings.
The spending multiplier in a deep recession
Taken at face value, our finding that the expansionary multiplier is small suggests that government spending can be a costly way to stimulate the economy.
What does this imply for the efficacy of government stimulus in the current downturn? One important feature of the current recession is that the main monetary policy tool, the federal funds rate, is constrained by the zero lower bound, leaving little room to lower interest rates to boost the economy. Because an increase in government spending raises inflation, in normal times monetary policymakers react by raising interest rates. This response tends to mute the boost in output. However, in a deep downturn, monetary policymakers are unlikely to raise interest rates, so an increase in government spending is more likely to result in a larger multiplier. In addition, when monetary policy is unable to lower interest rates because of the zero lower bound, real interest rates end up being too high, thus restricting economic activity. By boosting inflation and expected inflation, government spending can have the beneficial effect of lowering real interest rates and stimulating the economy further.
We can use an expanded version of our model to study the impact of the zero lower bound on the expansionary multiplier. We find that an economic downturn severe enough to push monetary policy to its zero lower bound results in a higher expansionary multiplier. If the zero lower bound binds for some time, the multiplier can reach and even surpass one.
Thus, our results indicate that government purchases could be an effective way to stimulate an economy during a deep recession when monetary policy is constrained at the zero lower bound. Unfortunately, there is not enough evidence to empirically estimate the magnitude of that effect in the United States, because times with a binding zero lower bound have been rare historically. However, our conclusion is consistent with recent evidence that the spending multiplier can be above 1.5 when monetary policy is held fixed (see Nakamura and Steinsson 2014, Miyamoto, Nguyen, and Sergeyev 2018).
Conclusion
Recent research has shown that the effectiveness of fiscal tools can depend on the underlying economic conditions, for example whether the economy is in a boom versus a slump. In this Letter, we show that the effectiveness of fiscal policy can also depend on the direction of the intervention—expansionary versus contractionary. In particular, we find that the expansionary multiplier is generally smaller than the contractionary multiplier. An exception occurs in deep downturns, particularly when monetary policy is expected to stay at the zero lower bound for a substantial time, as is currently the case. In that situation, the expansionary multiplier can be much larger.
Regis Barnichon is a senior research advisor in the Economic Research Department of the Federal Reserve Bank of San Francisco.
Davide Debortoli is an associate professor at Universitat Pompeu Fabra, Barcelona GSE
Christian Matthes is an associate professor at Indiana University
References
Barnichon Regis, Davide Debortoli and Christian Matthes. 2020. “Understanding the Size of the Government Spending Multiplier: It’s in the Sign.” FRB San Francisco Working Paper 2020-01, forthcoming in Review of Economic Studies.
Daly, Mary C., and Bart Hobijn. 2014. “Downward Nominal Wage Rigidities Bend the Phillips Curve.” Journal of Money, Credit, and Banking 46.S2, pp. 51–93.
Leduc, Sylvain, and Daniel Wilson. 2012. “Highway Grants: Roads to Prosperity.” FRBSF Economic Letter 2012-35 (November 26).
Miyamoto, Wataru, Thuy Lan Nguyen, and Dmitriy Sergeyev. 2018. “Government Spending Multipliers under the Zero Lower Bound: Evidence from Japan.” American Economic Journal: Macroeconomics 10(3), pp. 247–277.
Nakamura, Emi, and Jon Steinsson. 2014. “Fiscal Stimulus in a Monetary Union: Evidence from U.S. Regions.” American Economic Review 104(3), pp. 753–792.
Ramey, Valerie A., and Sarah Zubairy. 2018. “Government Spending Multipliers in Good Times and in Bad: Evidence from U.S. Historical Data.” Journal of Political Economy 126(2), pp. 850–901.
Wilson, Daniel J. 2020. “The COVID-19 Fiscal Multiplier: Lessons from the Great Recession.” FRBSF Economic Letter 2020-13 (May 26).
Opinions expressed in FRBSF Economic Letter do not necessarily reflect the views of the management of the Federal Reserve Bank of San Francisco or of the Board of Governors of the Federal Reserve System. This publication is edited by Anita Todd and Karen Barnes. Permission to reprint portions of articles or whole articles must be obtained in writing. Please send editorial comments and requests for reprint permission to research.library@sf.frb.org