
The COVID-19 pandemic generated sharp losses in employment in early 2020, followed by a partial but incomplete recovery that continues to this day. The effects on employment in business sectors that produce goods and those that provide services varied substantially across states. This was the case during both the initial drop and the subsequent recovery. The extent of the cross-state variation and how the variation has evolved over time has been unlike any past recessions, making the pandemic recession and recovery unprecedented in both its severity and its uneven impact.
The COVID-19 pandemic produced an unprecedented hit to labor markets. In March and April 2020, economic activity collapsed when many states implemented mandatory social-distancing requirements, many businesses closed and laid off or furloughed workers, and fear of the virus led other workers to quit (see Petrosky-Nadeau and Valletta 2020 and Wolcott, et al. 2020). The unemployment rate jumped from 3.5% in February to nearly 15% in April, its highest level since the Great Depression. Relative to the February 2020 peak in employment, the number of payroll employees fell by almost 15%, equivalent to more than 22 million workers.
Since the initial fall in employment, labor markets have recovered as economic activity rebounded. While virus risks from new variants and regional surges have made the economic recovery uneven over time, relaxed social-distancing measures and increased vaccination rates have also resulted in a growth in labor demand and more employment. Furloughed employees returned to work and laid-off workers were hired at new jobs; however, labor markets have not yet fully recovered. As of September 2021, payroll employment still sat below its pre-pandemic peak by 3.1%, or over 4.7 million jobs.
In this Economic Letter, we study how employment dynamics during the pandemic have differed across states and sectors. Employment in goods-producing sectors such as construction and manufacturing followed a different trajectory than employment in service-providing sectors such as leisure and hospitality, education and health, or retail trade. Likewise, states experienced vastly different employment outcomes during that time.
The differences across sectors and states reflect a confluence of factors during the pandemic, including the feasibility of telework, reduced demand in some sectors, the sectoral composition of states’ employment, and varying state policy responses to the pandemic (Foerster, Garvey, and Sarte 2021). As a result of these factors, the outcomes across states have been both wide-ranging and unlike those seen in previous recessions. The COVID recession thus is unprecedented not only in how sharply it hit labor markets but also in how much its influence has varied across states.
Goods-producing and service-providing employment in the pandemic
At the onset of the pandemic, U.S. employment declined almost 15% as of April 2020 relative to its pre-pandemic peak in February 2020. These job losses were not evenly distributed across sectors and states. To track the evolution across these dimensions, we consider the percent difference in employment relative to February 2020 in private goods-producing and service-providing sectors.
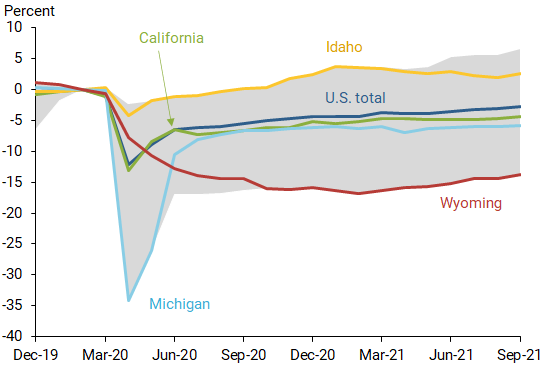
Goods-producing employment, which includes mining, construction, and manufacturing, makes up about 15% of overall employment. The dark blue line in Figure 1 shows that national employment in goods-producing sectors fell by 12.1%, or 2.6 million jobs. After this decline, there was a relatively modest rebound, followed by a slow convergence back towards the pre-pandemic level. By September 2021, goods-producing employment was around 2.7%, or 567,000 jobs, below its February 2020 level.
Figure 1
Change in goods-producing employment since February 2020
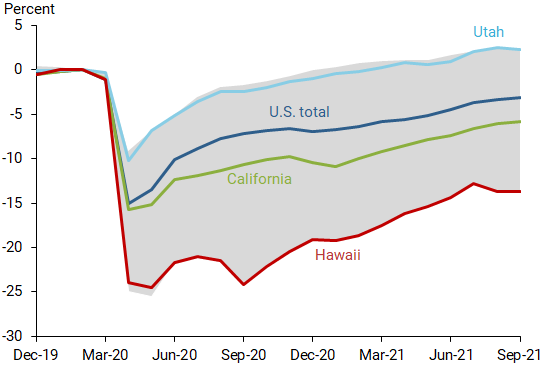
Service-providing employment, which includes leisure and hospitality, education and health, retail trade, and professional and business services, makes up the remaining 85% of total employment in the United States. The dark blue line in Figure 2 shows that service employment declined by a somewhat larger proportion, 15.1%, or 19.8 million jobs, by April 2020. It then experienced a relatively steady recovery, reaching 3.2%, or almost 4.2 million jobs, below its pre-pandemic level by September 2021. A study by David (2021) found that, except for the leisure and hospitality sector, jobs have been reallocated across sectors much less during the pandemic than in previous recessions. This could reflect that workers have had a harder time changing occupations and industries due to challenges related to the pandemic, which may be playing a role in these recovery dynamics.
Figure 2
Change in service-providing employment since February 2020
The dynamics of both goods-producing and service-providing employment in the United States mask a substantial amount of variation across states. The gray region in Figure 1 encompasses the full range across states for the change in goods-producing employment since February 2020. The figure also depicts the paths for a few selected states to highlight their differences. For example, California closely tracks the U.S. total, while Idaho is consistently at the top of the range. The worst performers over this time were Michigan early in the pandemic and Wyoming later.
The best and worst performers highlight the importance of sectoral composition on states’ dynamics. Idaho’s relative strength in goods-producing employment came from particularly strong construction growth during this period. Michigan initially saw steep declines due to a large-scale shutdown of manufacturing capacity in sectors such as the automotive industry due to stay-at-home orders. Later, the state had a rapid rebound when stay-at-home orders were relaxed, and its goods-producing employment then began tracking the national rate quite closely. Wyoming did not see a sharp drop in goods-producing employment, but instead experienced a more drawn-out decline. In this case, and in contrast to the rest of the country, the state was already in a decline ahead of the pandemic. The pandemic exacerbated the slowdown in construction, mining, and manufacturing employment.
Service-providing employment likewise had a high degree of variability across states, shown by the gray region in Figure 2 and selected state dynamics. Once again, California followed the national average relatively closely, although to a lesser extent than for goods-producing employment. Utah has been at the high end of the range, driven in part by relatively strong growth in professional and business services. Hawaii, on the other hand, has consistently lagged during the recovery due to its high dependence on tourism: Hawaii’s leisure and hospitality sector has fared poorly, producing weak dynamics for overall service-providing employment.
Unprecedented range of outcomes
The range of states’ employment outcomes in goods-producing and service-providing sectors—indicated by the gray regions in Figures 1 and 2, respectively—point to substantial differences in how the pandemic affected states. We track that variation over the course of the recession and recovery and compare the results with the three most recent recessions that began in 1991, 2001, and 2008 (see Valletta and Cleary 2008 for a discussion of sectoral reallocation during the Global Financial Crisis). We focus on the range, but other measures of variation, such as the standard deviation (not shown), yield similar conclusions.
Figure 3 shows the magnitude of the cross-state range—that is, the maximum minus the minimum—over time for goods-producing employment during the pandemic recession and each of the previous three recessions. Higher values indicate more variation across states, while lower values indicate less variation. For the goods sector, states saw employment declines ranging from highs of more than 30% to lows of only a few percent by April 2020, leading to a range of almost 35 percentage points. After Michigan rebounded sharply, the range has held steady at around 15-20 percentage points.
Figure 3
Range of goods-producing employment across states
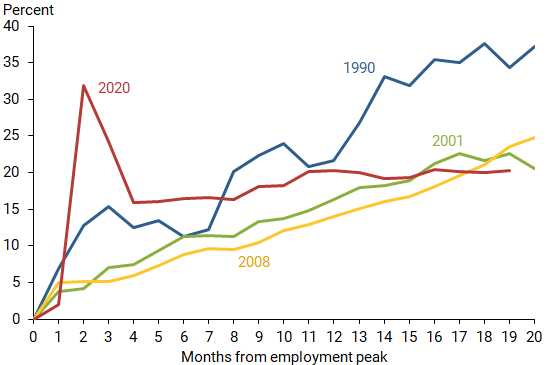
The spike in the range at the onset of the COVID recession led to a dramatically different path of variation relative to previous recessions. In typical recessions, downturns in goods-producing employment start similarly across states, and differences grow over time as longer-term trends take hold, for example driving divergences in manufacturing or construction. The COVID recession, on the other hand, saw large initial differences due to policy responses by individual states, but those differences have been stable since.
Figure 4 shows the corresponding range for service-providing employment and compares the range with previous recessions. In service employment, the range has been more stable. Initially, the range increased sharply to around 20 percentage points, as states experienced employment declines of between 10% and 30%. After that initial change, the range slightly increased over the following months to almost 25 percentage points and then has gradually declined to about 15 percentage points as states recovered.
Figure 4
Range of service-providing employment across states
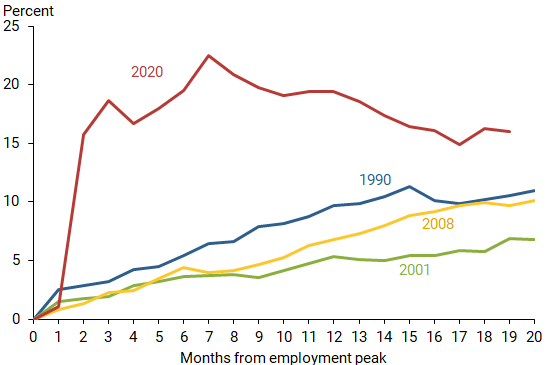
The range of service-providing employment across states likewise shows an unusual dynamic relative to previous recessions. In the three previous recessions, differences across states started very low and increased only gradually. In the COVID recession, the range across states was larger 19 months after the employment peak than over the same length of time in previous recessions. This wide range of employment experiences across states points to the challenge of providing a summary of the U.S. economic condition: a national average cannot accurately reflect the experiences across all states during the recovery.
Conclusion
The COVID-19 pandemic led to dramatic declines in employment in both goods-producing and service-providing sectors, and the recovery in employment has continued but is still incomplete. Job dynamics in each sector have differed. Likewise, states have experienced widely dissimilar trajectories in both employment losses and in the recovery. The differences in employment outcomes across states have not followed the same pattern as in previous recessions.
The COVID recession is thus striking not only for how sharply labor market conditions deteriorated and the speed of the subsequent recovery, but also for how different the effect on states has been. The confluence of factors unique to the pandemic has played a large role in the different outcomes. Some of these factors are related to state policies, while others are due to sectoral structure and dependence on specific industries. The wide differences in both the impact of the initial COVID shock and the recovery dynamics suggest that policies to support the ongoing employment recovery, and also to respond to future economic disruptions, might benefit from being tailored to individual state characteristics.
Sarah Albert is a research associate in the Economic Research Department of the Federal Reserve Bank of San Francisco.
Andrew Foerster is a senior research advisor in the Economic Research Department of the Federal Reserve Bank of San Francisco.
Pierre-Daniel G. Sarte is a senior advisor in the Economic Research Department of the Federal Reserve Bank of Richmond.
References
David, Joel. 2021. “Has Covid-19 Been a ‘Reallocation Recession’?” FRB Chicago, Chicago Fed Letter 452 (March).
Foerster, Andrew, Nicholas Garvey, and Pierre Sarte. 2021. “Anatomy of a Pandemic Recovery by Sector and Region.” FRB Richmond Economic Brief (forthcoming).
Petrosky-Nadeau, Nicolas, and Robert G. Valletta. 2020. “An Unemployment Crisis after the Onset of COVID-19.” FRBSF Economic Letter 2020-12. May 18.
Valletta, Robert, and Aisling Cleary. 2008. “Sectoral Reallocation and Unemployment.” FRBSF Economic Letter 2008-32. October 17.
Wolcott, Erin, Mitchell G. Ochse, Marianna Kudlyak, and Noah A. Kouchekinia. “Temporary Layoffs and Unemployment in the Pandemic.” FRBSF Economic Letter 2020-34. November 16.
Opinions expressed in FRBSF Economic Letter do not necessarily reflect the views of the management of the Federal Reserve Bank of San Francisco or of the Board of Governors of the Federal Reserve System. This publication is edited by Anita Todd and Karen Barnes. Permission to reprint portions of articles or whole articles must be obtained in writing. Please send editorial comments and requests for reprint permission to research.library@sf.frb.org