
The relationship between economic activity and local COVID-19 conditions—infections and deaths—has changed over time. While activity was strongly tied to local virus conditions during the first six to nine months of the pandemic, they decoupled in late 2020 through the first half of 2021. This link strengthened again in the third quarter of 2021, particularly for highly vaccinated counties. One possible interpretation of this restrengthening is that areas with high vaccination rates have heightened virus risk aversion and hence high sensitivity to changes in local virus conditions.
The U.S. economy became inextricably linked to the public health conditions posed by COVID-19 in March 2020. The September 2020 FOMC statement predicted, “The path of the economy will depend significantly on the course of the virus” (Board of Governors 2020). That was particularly true for economic activity that cannot be done online, such as restaurant dining and in-person retail shopping. Now, roughly one year after that statement, has the U.S. economy become less tied to the pandemic? For instance, U.S. consumers may have become fatigued by avoiding in-person activities or may have increasingly found ways to minimize potential virus exposure while engaging in such activities.
This Economic Letter uses daily county-level data to assess the statistical relationship between economic activity and local COVID-19 conditions. We analyze how COVID-19 conditions affect various economic outcomes, allowing these relationships to vary over time. We account for potential reverse causality, whereby economic outcomes may affect COVID-19 conditions, and for national and state factors such as fiscal policies and health restrictions.
We find that local economic activity was strongly related to local COVID-19 conditions for the first six to nine months of the pandemic but then decoupled around the end of 2020. Yet, we also find some evidence of a recoupling, that is, a return to the earlier strong relationships, in the third quarter of 2021.
We then examine what impact vaccinations in the spring and summer of 2021 may have had on the relationship between local economic activity and local COVID-19 infections. We find higher vaccination rates are associated with increased economic activity. We also find that the link between economic activity and COVID-19 infections is stronger in counties with higher vaccination rates. A possible explanation is that high vaccination rates signal high virus risk aversion by local consumers and workers, which leads in-person economic activity to depend heavily on virus conditions.
The national picture
The U.S. economy, especially sectors involving in-person activity such as retail shopping and restaurant dining, became strongly linked to COVID-19 health conditions when the pandemic began in early 2020. This relationship can be seen in Figure 1, which compares the national index of retail and restaurant visits from mobile device geolocation data (Google Community Mobility Reports) with daily COVID-19 deaths per capita (usafacts.org). Credit card spending on retail, restaurants, and hotels (tracktherecovery.org) show a similar pattern.
Figure 1
National retail and restaurant activity and COVID-19 deaths
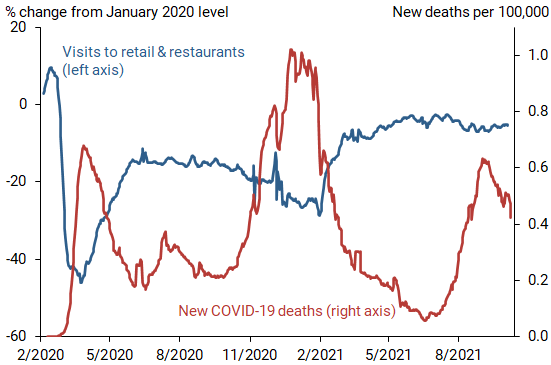
Note: Daily data through October 23, 2021.
COVID-19 deaths spiked in spring 2020, and in-person retail and restaurant activity plummeted. This first wave of the virus subsided in May, and retail and restaurant visits and spending rebounded. In-person activity then fell again in late 2020 and early 2021 during the second wave. More recently, virus conditions, driven largely by the Delta variant, worsened again starting around the end of July 2021. In-person retail and restaurant activity again showed signs of softening, but the drop was much smaller than those seen in earlier surges of COVID-19.
Cross-county analysis
One can only learn so much from simple time series comparisons. We have only one national economy, while many other national and global factors besides COVID-19 affect economic activity. Such factors include fiscal policies like tax rebates, enhanced unemployment benefits, eviction moratoriums, the Paycheck Protection Program, and expanded child tax credits.
So here we turn to county data, the most granular level of geographic data available for both local economic activity and local COVID-19 conditions. By conducting our analysis at the county level, we can take advantage of the variation across counties at a given point in time to provide more explanatory power than analysis on a purely national level. This also enables us to assess whether the estimated relationship between the virus and economic conditions has changed over time. More generally, our data and framework enable us to test the validity of these underlying relationships.
By applying a statistical technique known as fixed-effects regression, we account for factors that are common to all counties in a state, such as statewide mask mandates or business restrictions, along with national factors like fiscal policies. We are also able to account for county characteristics that are largely fixed over our period of analysis, such as local demographic composition, by estimating how the changes in a county’s economic activity respond to changes in its COVID-19 conditions.
Our analysis accounts for one other potential issue: reverse causality. Our aim is to identify the extent to which changes in local virus conditions lead to changes in local economic activity. However, the causation may go in the other direction: an increase in such activity may increase local virus exposure. We take two steps to address this concern. First, we measure virus conditions using the number of new cases per capita over the preceding 14 days. Changes in current economic activity should not affect past COVID-19 cases. Second, we directly account for economic activity as of 14 days prior, which implicitly accounts for any direct, reverse causal effects that activity may have on subsequent COVID-19 cases.
We estimate this regression for three different indicators of county economic activity, focusing on their response to recent COVID-19 cases, on a per person basis (from usafacts.org). All three indicators are indexes measuring percentage changes in activity relative to a January 2020 baseline (from tracktherecovery.org). The first index is retail and restaurant visits from Google Mobility Reports. The second is consumer spending by county residents based on all credit card transactions, from the data services company, Affinity Solutions. Note that these data reflect both in-person spending and online spending, likely reducing the response of this measure to local virus conditions. Third, we look at initial jobless claims, which generally reflect job losses; it is not as comprehensive a measure of local labor market conditions as employment but is available in near real time.
Figure 2 plots the relationship for each of these three measures of activities with the number of recent COVID-19 cases (excluding deaths) per 100,000 residents from the second quarter of 2020 to the third quarter of 2021. The gray brackets around each marker show its 90% confidence interval.
Figure 2
Estimated relationships between local activity, COVID cases
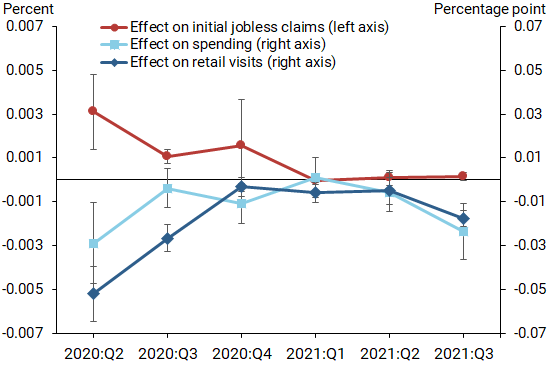
Note: Data through September 30, 2021. COVID-19 cases measured per capita.
Local economic activity was strongly related to local COVID-19 conditions for the first two or three quarters of the pandemic, depending on the measure. Specifically, on average, in counties where COVID-19 cases were rising, retail visits and consumer spending fell and initial jobless claims climbed, while in counties where cases were falling, the opposite was true. These relationships faded and became statistically insignificant by late 2020 or early 2021. The results on consumer spending echo those of Cotton, Garga, and Rohan (2021), who additionally found that the early negative relationships with COVID-19 were strongest for spending in social-distance-sensitive activities like retail and restaurants.
The significant links between local COVID-19 conditions and local economic activity returned in the third quarter of 2021, which coincide with the deterioration in virus conditions driven by the Delta variant. In particular, we find negative and significant relationships for recent cases for overall spending and in-person retail and restaurant activity.
The role of vaccinations
We next examine what effect vaccination rates in the spring and summer of 2021 had on the relationship between economic activity and COVID-19. To do this, we extend the above analysis by explicitly accounting for vaccination rates using Centers for Disease Control and Prevention daily county-level data on the share of the population that is fully vaccinated and allowing for the effects of COVID-19 cases to be different for high and low vaccination counties.
First, we find local vaccination rates have a strong statistical relationship with local economic activity (not displayed in a chart). The relationship is positive for consumer spending and for retail and restaurant visits and negative for initial jobless claims. This suggests that higher vaccination rates may, on average, lessen local consumers’ and workers’ fears of in-person activities and thus stimulate local retail shopping and restaurant dining.
Second, by allowing the effects of COVID-19 cases to be different for high and low vaccination counties, we find in-person retail and restaurant visits and jobless claims are more strongly linked to COVID-19 conditions in counties with higher vaccination rates. In particular, panel A of Figure 3 shows the effect of COVID-19 cases per capita on retail and restaurant visits—as in Figure 2—except that now this effect is allowed to differ between high and low vaccination counties for the latest two quarters. For illustrative purposes, we plot the implied effects for counties with vaccination rates at the 90th (high) and 10th percentiles (low). Panel B shows the analogous results for jobless claims. By contrast, we find no differential effect of high and low vaccination counties for credit card spending (not shown), likely because much of that spending can be done remotely.
Figure 3
Relationship between local activity and cases per capita, varying by vaccination rates
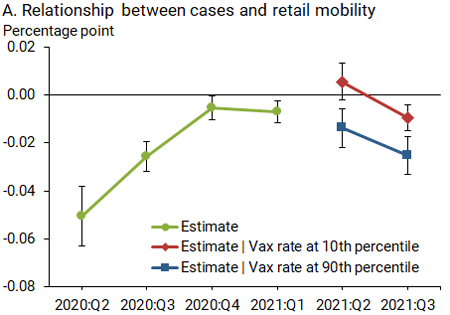
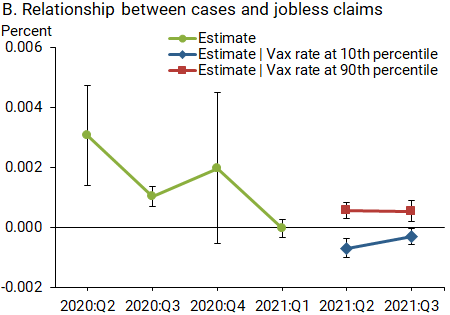
One might have expected a high vaccination rate in a county to reduce local consumers’ and workers’ concerns about the virus, thereby loosening the link between virus conditions and economic activity. Instead, we find the opposite. One possible explanation is that a lower vaccination rate may reflect lower virus fears in that county. Put differently, counties where more residents are concerned about avoiding the virus may also be counties with high vaccine demand. Under this interpretation, higher vaccination rates are not a cause of a tighter relationship between virus conditions and economic activity but rather a signal of high local risk aversion in regard to virus exposure.
Conclusion
We find that local economic activity in U.S. counties was closely related to local COVID-19 conditions last year but gradually became decoupled as the pandemic wore on. However, there is some evidence that the connection in some areas strengthened in recent months, perhaps due to the rapid spread of the Delta variant. We also find that the link is stronger in highly vaccinated counties, suggesting that higher vaccination rates may signal higher virus risk aversion. Monitoring local data in the future may give valuable insights. In particular, further waves of the pandemic might strengthen the link with local activity, or local economic conditions might once again decouple from COVID-19 health conditions, implying limited impacts of future outbreaks on the economy.
Samuel R. Tarasewicz is a research associate in the Economic Research Department of the Federal Reserve Bank of San Francisco.
Daniel J. Wilson is vice president in the Economic Research Department of the Federal Reserve Bank of San Francisco.
References
Board of Governors of the Federal Reserve System. 2020. “Federal Reserve issues FOMC statement.” Press release, September 16.
Chetty, Raj, John N. Friedman, Nathaniel Hendren, Michael Stepner, and The Opportunity Insights Team. 2020. “The Economic Impacts of COVID-19: Evidence from a New Public Database Built Using Private Sector Data.” NBER Working Paper w27431. Related data available at www.tracktherecovery.org
Cotton, Christopher D., Vaishali Garga, and Justin Rohan. 2021. “Consumption Spending and Inequality during the COVID-19 Pandemic.” Covid Economics 83(2, July), pp. 116–154.
Opinions expressed in FRBSF Economic Letter do not necessarily reflect the views of the management of the Federal Reserve Bank of San Francisco or of the Board of Governors of the Federal Reserve System. This publication is edited by Anita Todd and Karen Barnes. Permission to reprint portions of articles or whole articles must be obtained in writing. Please send editorial comments and requests for reprint permission to research.library@sf.frb.org