
The longest-term U.S. Treasury bonds that investors can buy mature in 30 years. Some other countries offer up to 50-year government bonds. Examining these foreign bond markets and extrapolating U.S. Treasury yields to evaluate such longer-term options suggests that the extra costs of introducing 50-year bonds relative to conventional 30-year bonds are likely to be small on average. Because the U.S. fiscal deficit remains substantial, such longer-term debt instruments could provide an attractive opportunity to finance the growing debt in a sustainable way.
The U.S. federal debt is large and growing. At the end of 2020, the Treasury’s total outstanding marketable debt reached $21 trillion—about the same as the country’s nominal GDP—after rising nearly 25% in a single year from $16.7 trillion at the end of 2019. With the deficit expected to remain elevated in the coming years, it’s practical to examine sustainable ways to finance the debt.
One possibility would be to extend the maximum debt maturity from its well-established 30 years to 50 years. The main potential benefit would be to guarantee funding for a full 50 years. Given the government’s ability to tax in perpetuity, such long-dated debt may better match its future debt payments and tax receipts. Second, it would offer protection in case interest rates rise much above expected levels because the interest payment is fixed at the stated coupon rate until maturity. This may help reduce stress on future government budgets. Finally, a 50-year Treasury bond could expand and diversify the set of investors available to help meet funding needs. This was the motivation behind some other novel U.S. debt instruments, such as Treasury Inflation-Protected Securities in 1997 and floating-rate notes in 2014.
These benefits have to be weighed against potential extra costs of extending the debt maturity. These costs reflect the higher compensation that investors have historically required for buying longer-term debt. Unfortunately, because no such Treasury is trading in the current market, we have to estimate how much more investors might demand in exchange for buying this longer-term debt.
In this Letter, we describe recent research by Christensen, Lopez, and Mussche (2021b) estimating what it would cost the U.S. government to extend the maximum maturity from 30 to 50 years. First, we analyze data from international markets that already offer such long government bonds. Next, we use U.S. Treasury yield data with maturities up to 30 years to extrapolate a hypothetical 50-year bond yield. The results from both exercises suggest that the added costs of issuing 50-year bonds to complement the current 30-year bonds are likely to be small, averaging less than 0.2%.
Evidence from an international panel of government bonds
To provide international evidence on the potential costs of a debt maturity extension and to better understand trading patterns of long-lived securities, we collect data from four well-established government bond markets that have already issued such long-term bonds. Specifically, we study all standard daily fixed-coupon government bond prices in Austria and France since 1999, in Switzerland since 1993, and in the United Kingdom since 1990. The start dates for Austria and France align with the introduction of the euro to avoid issues related to the currency denomination, while the start dates for Switzerland and the United Kingdom are determined by data availability. For all four countries, the data run through the end of 2020. Finally, to obtain accurate fitted yields in the very long end of the yield curve, which is particularly important in our case, we estimate a very flexible yield curve model taken from Christensen, Diebold, and Rudebusch (2009) using the bond price data from each country.
We note that the U.S. Treasury issues notes and bonds close to par—that is, investors pay close to $1 for each promised $1 at maturity. To achieve this, they adjust the coupon rate of the securities at the initial auction by increments of 0.125%. To match this coupon choice for international securities, we use the estimated model for each country to calculate the model-implied yield of synthetic bonds with prices at par. We focus on these so-called par yields for bonds with 30 years and 50 years to maturity. The difference between the 50-year and 30-year par yields then becomes a measure of the added cost of issuing a 50-year bond on a given day instead of a 30-year bond. Figure 1 shows par yield spreads for our international bond data. For accuracy, we only report data for the period since the first 50-year bond was issued, which determines the start date of the series for each country in the figure. Because of the small yield increments, we discuss the data in term of “basis points,” which are hundredths of a percentage point.
Figure 1
International yield spreads of 50-year over 30-year bonds
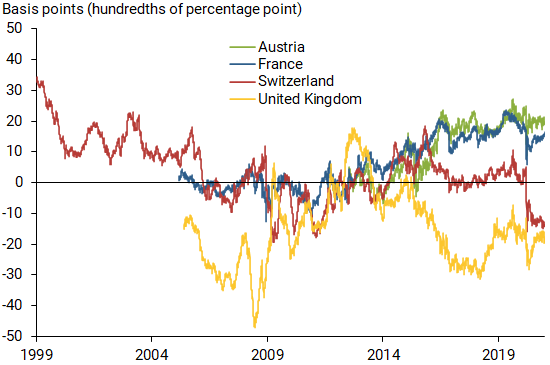
This cost measure implied by the Austrian data (green line) starting in 2012 averages 12 basis points with a mild upward trend that leaves it close to 20 basis points by the end of 2020. For the French data (blue line) starting in 2005, the cost measure averages 6 basis points with a mild upward trend that leaves it close to 10 basis points by the end of 2020. The cost measure based on French bond data is highly correlated with the series implied by the Austrian bond data, with an 88% correlation for the overlapping period since 2012. This suggests that long-term bonds are priced very similarly across core government bond markets in the euro area.
The Swiss data (red line) show a clear downward trend in our synthetic cost measure. It starts out above 30 basis points in 1999 and ends below –10 basis points by the end of 2020. For the entire period since 1999, it averages 4 basis points. Thus, the Swiss government appears to face almost no tradeoff in pricing between issuing 30-year and 50-year bonds.
Finally, similar to the Swiss results, the U.K. cost measure (gold line) is mostly negative, meaning that the U.K. government has generally been able to issue 50-year bonds at yields below those of newly issued 30-year bonds. Indeed, our U.K. measure has averaged –15 basis points since the first 50-year bond was issued in 2005. Consequently, issuing even more very long-term debt could benefit the U.K. government.
Next, we examine whether the introduction of 50-year bonds in the four international bond markets had any notable impact on the pricing of the existing long-maturity bonds in these markets. We focus on the spread between the 30-year and 10-year par yields implied by our models. The 10-year maturity tends to be one of the most liquid points on the yield curve in most government bond markets and therefore is not likely to be affected by the introduction of 50-year bonds. However, this may not be the case for the less liquid 30-year segment of the yield curve. Given that we are interested in market movements at around the time the first 50-year bonds are issued, we start to track these yield spread series two years before the introduction of the 50-year bond and end the analysis two years afterward, as shown in Figure 2.
Figure 2
Market impact of introducing 50-year bond
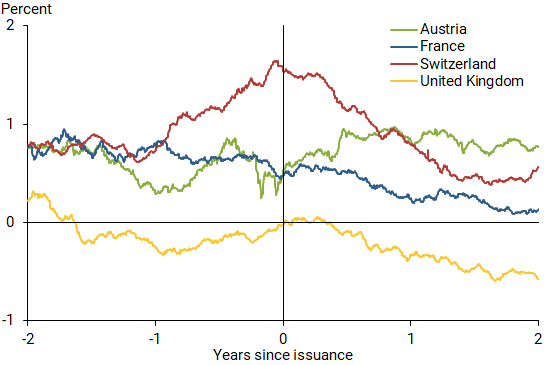
The main takeaway from this figure is that the launch of the 50-year bond series in these foreign markets appears to have had, at most, modest effects on the relative pricing of existing 10-year to 30-year bonds. Overall, this outcome is reasonable given that the markets receive no new information from this issuance choice beyond getting a sense of the demand for very long-term bonds.
In Christensen et al. (2021b), we also examine bid-ask spreads of 30-year and 50-year bonds in three of these four markets. The data show that the current market liquidity for 50-year bonds as measured by bid-ask spreads does seem to be somewhat below that of 30-year bonds, but not by a wide margin. Also, as documented in Figure 1, the impact on the pricing of 50-year bonds seems small.
Extrapolating U.S. Treasury yields
To complement our international analysis, we turn to U.S. Treasury yield data with maturities of up to 30 years to extrapolate what a hypothetical 50-year bond yield might have been historically. We follow Christensen, Lopez, and Mussche (2021a) and estimate a standard yield curve model with three factors representing the level, slope, and curvature of the yield curve. We estimate the model using a sample of Treasury yields with 11 maturities from 3 months to up to 30 years observed weekly from January 1995 through December 2020. As before, we estimate par yields at relevant maturities.
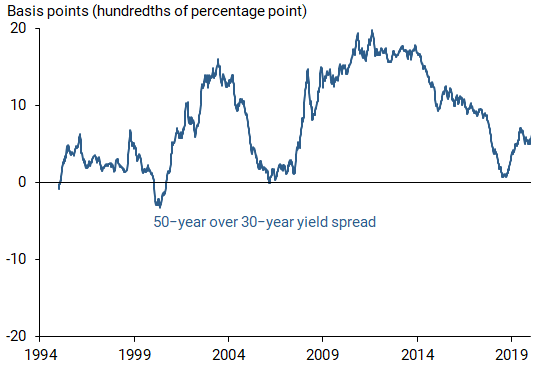
Results from the empirical model closely match the bond yields in our estimation sample. With the model’s estimated parameters, we then extrapolate the value for par yields with longer maturities, including 50-year yields; see a discussion of the accuracy of such yield extrapolations in Christensen et al. (2021a). Figure 3 shows the extrapolated 50-year over 30-year par yield spread based on the estimated model. This extrapolated cost measure is mostly positive but low, fluctuating between –1 and 20 basis points with pronounced variation that aligns with the state of the economy. In particular, the measure is near zero when the Treasury yield curve is flat or inverted and is close to its maximum value of nearly 20 basis points when the Treasury yield curve is steep. For the entire 26-year period, our extrapolated cost measure averages 8 basis points. The results suggest that the additional cost to the Treasury from issuing longer-maturity bonds would be low, similar to the experiences in some other countries.
Figure 3
Extrapolated U.S. yield spreads of 50-over-30-year bonds
Conclusion
In this Letter, we estimate the potential cost to the U.S. Treasury of extending the maximum maturity of its issued debt from 30 years to 50 years. In one approach, we examine the international evidence from four established government bond markets where such longer-maturity bonds are already trading. Our results reveal a cost difference that tends to be less than 20 basis points and can even be negative in some markets. In another approach, we rely on yield curve extrapolations rooted in an estimated dynamic yield curve model using U.S. Treasury data. Our U.S. results are very similar to the international results and produce small yield differences. Taken together, these findings suggest that extending the maximum maturity of U.S. debt might be a cost-effective complement to issuing conventional 30-year bonds that could open a new sustainable option to help fund the national debt.
Jens H.E. Christensen is a research advisor in the Economic Research Department of the Federal Reserve Bank of San Francisco.
Jose A. Lopez is a vice president in the Financial Institution Supervision and Credit Division of the Federal Reserve Bank of San Francisco.
Paul L. Mussche is a senior quantitative risk specialist in the Financial Institution Supervision and Credit Division of the Federal Reserve Bank of San Francisco.
References
Christensen, Jens H.E., Francis X. Diebold, and Glenn D. Rudebusch. 2009. “An Arbitrage-Free Generalized Nelson-Siegel Term Structure Model.” Econometrics Journal 12(3), pp. C33–C64.
Christensen, Jens H.E., Jose A. Lopez, and Paul L. Mussche. 2021a. “Extrapolating Long-Maturity Bond Yields for Financial Risk Measurement.” Forthcoming in Management Science, available as FRB San Francisco Working Paper 2018-09.
Christensen, Jens H.E., Jose A. Lopez, and Paul L. Mussche. 2021b. “International Evidence on Extending Sovereign Debt Maturities.” FRB San Francisco Working Paper 2021-19.
Opinions expressed in FRBSF Economic Letter do not necessarily reflect the views of the management of the Federal Reserve Bank of San Francisco or of the Board of Governors of the Federal Reserve System. This publication is edited by Anita Todd and Karen Barnes. Permission to reprint portions of articles or whole articles must be obtained in writing. Please send editorial comments and requests for reprint permission to research.library@sf.frb.org