
Racial disparities in socioeconomic outcomes for the U.S. population are often masked by aggregate statistics. Unemployment rates vary significantly across groups according to gender and race or ethnicity and have different sensitivities to the business cycle. Focusing on jobless rates by demographic groups shows that Black and Hispanic workers, particularly men, are the most sensitive to periods of economic growth and decline. This higher sensitivity persists across individuals with the same education level. Occupation plays a role in explaining the relative cyclical differences in unemployment rates across demographic groups.
Market economies tend to go through business cycles where periods of economic decline are followed by rising economic activity. Broad economic indicators tend to move with the business cycle, signaling when the economy is in a poor or a good state. However, measuring the health of the economy solely through aggregate statistics hides the fact that an economic downturn affects some demographic groups more than others and that they benefit from expansions to different degrees.
The unemployment rate is widely used to assess the state of the economy because it varies strongly with the business cycle, rising when the economy is in a recession and gradually decreasing during economic booms. However, economic fluctuations affect unemployment for various groups differently depending on gender and race or ethnicity. This Economic Letter measures the sensitivity of unemployment rates for different groups to changes in the aggregate unemployment rate. The evidence suggests that Black and Hispanic workers, especially men, face higher unemployment than the national average during economic downturns and benefit from expansions to different degrees. One reason is that a larger share of people in these groups work in occupations such as construction and extraction that react more to fluctuations in the business cycle.
Labor market sensitivity
I measure a group’s sensitivity to the business cycle by estimating changes in its unemployment rate relative to changes in the average national unemployment rate. This demonstrates whether a specific group reacts to changing economic activity differently than the average worker. To illustrate the concept, Figure 1 shows the unemployment rate for workers age 16 and older by race and ethnicity relative to the total unemployment rate between January 2003 and February 2019. The dashed black line marks the 45-degree diagonal where unemployment for a group would equal the national unemployment rate.
Figure 1
Breakdown of unemployment rate by race and ethnicity
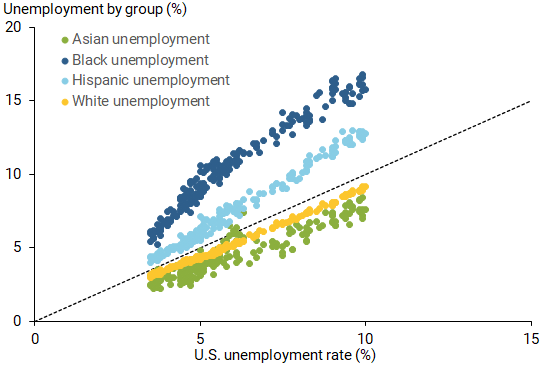
Source: Bureau of Labor Statistics, Current Population Survey (CPS). Seasonally adjusted monthly data for ages 16+ from January 2003 through February 2019.
Comparing unemployment rates for each group to the dashed black line reveals two separate characteristics. First, the position of a demographic group’s unemployment above or below the line shows whether it is higher or lower than the national average. Second, a steeper path of unemployment rates relative to the diagonal line reflects a higher sensitivity to aggregate business cycle conditions.
The figure shows the substantial differences in sensitivities that these demographic groups face. The differences are smallest at lower rates of unemployment. While a tight labor market draws more people from all backgrounds into jobs, it particularly benefits groups with higher unemployment. As a result, the dispersion in unemployment rates decreases. By the end of the long expansion in early 2020, the gap between Black and white unemployment rates had reached its lowest point since 1972 (Powell 2021). Conversely, an economy with a high overall unemployment rate tends to have wider gaps between the various groups, with particularly higher unemployment for Black and Hispanic workers.
Black and Hispanic workers not only face unemployment rates above the national average, they also have the highest sensitivities to changes in labor market conditions. White workers face conditions closest to the national average. The group with the lowest average sensitivity is Asian workers.
Consistent with earlier findings on the unemployment gaps between white workers and Black and Hispanic workers (Aaronson et al. 2019), this analysis shows a lower cyclical sensitivity of white workers compared to Black and Hispanic groups. This Economic Letter further explores the differences in changes of unemployment rates by different groups compared to the average national unemployment rate and extends the analysis to include the labor market outcomes of Asian workers over a longer horizon.
Racial and gender disparities
The Current Population Survey (CPS) has collected employment data since 1954, but only began adding separate racial indicators for Black workers in 1972 and for Hispanic workers in 1973. Asian workers were not listed as a separate category until 2003. Using CPS data, I estimate the relationship of each racial and ethnic group’s unemployment rate to the national rate for workers 16 and older. The slope of that relationship represents that group’s sensitivity to business cycle conditions (Figure 2). An estimated slope parameter of more than 1 indicates that, whenever the economy is in decline, this group faces even worse labor market conditions than the overall market. Conversely, as the economy improves, the unemployment rate of this group will decrease more quickly.
Figure 2
Labor market sensitivity by gender and race/ethnicity
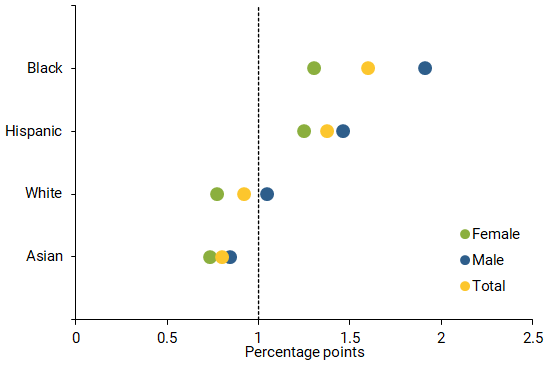
Source: Author’s calculation based on CPS unemployment rates.
Figure 2 shows that the Black and Hispanic populations have the highest labor market sensitivity among the four groups. A 1 percentage point change in the national unemployment rate is associated with a 1.6 percentage point change in the Black unemployment rate and a 1.4 percentage point change in the Hispanic unemployment rate. Asian workers have the lowest sensitivity, associated with a 0.8 percentage point change. White workers are the closest to the national unemployment rate and less reactive, with only a 0.9 average percentage point change in their unemployment rate.
Figure 2 also breaks down the results by gender, showing that women in every racial group (green dots) face less sensitivity than men (blue dots) across the business cycle. These results are consistent with research showing that female workers face lower volatility as measured by the cyclical component of aggregate hours worked per capita (Albanesi and Şahin 2018). The gender gap is widest for Black workers, with men having a 0.6 percentage point higher sensitivity than women. Notably, the unemployment rate for Black men moves 2 percentage points for every 1 percentage point movement in the national rate.
Education and occupation
Differences in educational and occupational attainment may explain part of the differences in sensitivities across demographic groups. More educational attainment improves labor market prospects, reducing the time spent in unemployment (Cairo and Cajner 2018). This may provide greater stability during economic downturns. Furthermore, certain demographic groups may make up more of the workforce in occupations where employment outcomes tend to be more cyclical.
Figure 3 shows a breakdown of labor market sensitivities by education and race/ethnicity. College-educated workers (red dots), regardless of race/ethnicity, experience less unemployment sensitivity to business cycle fluctuations. The gaps in sensitivity between education levels are smallest for Asian workers and highest for Black workers. Specifically, Black workers without a high school diploma are 2.5 times more sensitive to business cycle fluctuations than college-educated Black workers. Still, the unemployment rate for the college-educated Black population is more sensitive to the business cycle than for any other college-educated racial group. That is, the gap between Black workers and other workers persists at every level of education. Figure 3 illustrates that educational attainment plays a large role in explaining differences in sensitivities across racial groups. Cajner et al. (2017) confirm this finding for Hispanic workers, showing that the group’s unemployment gap can be largely explained by lower levels of education. Workers who have completed high school (green dots) show rather small differences in unemployment rate stability between racial groups relative to those with college degrees.
Figure 3
Labor market sensitivities by education
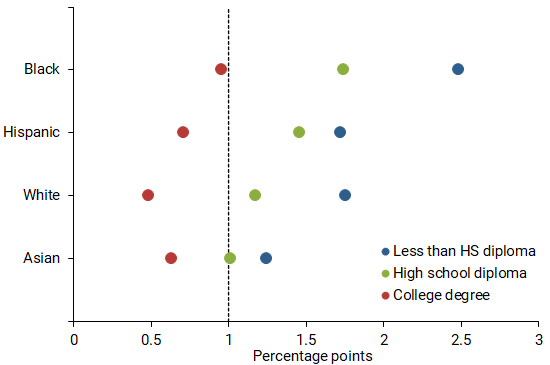
Source: Author’s calculation based on CPS unemployment rates.
In addition to educational attainment, occupation may play a role in explaining the differences in business cycle sensitivities. Traditionally, more women are employed in education and health occupations, while more men are in agriculture, construction, mining, and durable goods manufacturing. Transportation has a much higher share of Black workers. Hispanic workers are predominant in agriculture and construction, while professional and business services have a higher representation of Asian workers.
Certain industries and occupations have higher sensitivities to labor market fluctuations. Therefore, some of the differences between male and female labor market volatilities arise from the occupation and industry allocations for different groups.
To investigate the link between occupations and demographics, I first consider the share of workers from each demographic group relative to the share of the overall labor force employed in an occupation. For example, 5.3% of total workers are employed in construction, while the share of Hispanic workers in construction is 10.9%. In Figure 4, a ratio above 1 indicates disproportional employment in that occupation by women workers (green squares), Black workers (dark blue dots), or Hispanic workers (light blue dots). Listed next to each occupation is its numerical sensitivity to the business cycle, estimated using the method from Figures 2 and 3.
Figure 4
Breakdown of sensitivities and worker allocations by occupation
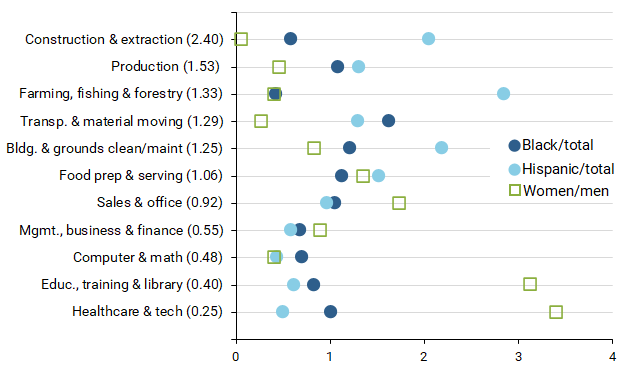
Source: Occupations are sorted by estimated sensitivities to labor market conditions (in parentheses). Data points show ratios of the share of workers by race to the share of the total labor force in each occupation and ratio of the share of women to the share of men in each occupation.
Estimates suggest that occupations in construction, agriculture, manufacturing, transportation, and cleaning/maintenance have the highest sensitivities to economic fluctuations. Occupations that require heavy manual labor and employ a higher proportion of men typically are the most sensitive. The first three occupations in Figure 4 collectively employed 17.9% of men and only 4.1% of women in 2019. The inverse relationship of sensitivities to occupations employing more women is especially evident when comparing the shares of women relative to men (green squares) with the sensitivities presented in parentheses next to each occupation. Black and Hispanic workers are more likely to work in high sensitivity occupations. For Hispanic workers, there is a strong relationship between the choice of occupation and labor market sensitivities, while this relationship is somewhat weaker for Black workers.
The construction sector, which employs about 18.6% of Hispanic men, has the highest sensitivity, measured at 2.4. Education and health services are some of the most stable occupations and employ disproportionately more women and fewer Black and Hispanic workers.
The overall picture suggests that the higher responsiveness of male workers, Black workers, and Hispanic workers is related to the occupations and industries in which they are employed. These include jobs that are traditionally more responsive to business cycle fluctuations and changes in economic activity.
Conclusion
Labor market sensitivities vary across gender and racial groups. The groups that face the most adverse impact from economic slowdowns are Black and Hispanic workers, especially men. Unemployment rates for these groups exceed the national average, and they react strongly to changes in labor market conditions. Findings in this Economic Letter suggest that gaps in job market success arise from differences in the distribution of men and workers of color that are typically employed in occupations and industries most sensitive to business cycle fluctuations. Differences in unemployment rates across groups are most pronounced during an economic downturn and fade over the course of an expansion. A sustained expansion therefore disproportionately improves labor market outcomes for the most vulnerable groups of workers.
Evgeniya A. Duzhak is a regional policy economist in the Economic Research Department of the Federal Reserve Bank of San Francisco.
References
Albanesi, Stefania, and Ayşegül Şahin. 2018. “The Gender Unemployment Gap.” Review of Economic Dynamics 30, pp. 47–67.
Aaronson, Stephanie R., Mary C. Daly, William Wascher, David W. Wilcox. 2019. “Okun Revisited: Who Benefits Most from a Strong Economy?” BPEA Conference Draft, Spring.
Cairó, Isabel, and Tomaz Cajner. 2018. “Human Capital and Unemployment Dynamics: Why More Educated Workers Enjoy Greater Employment Stability.” Economic Journal 128(609, March), pp. 652–682.
Cajner, Tomaz, Tyler Radler, David Ratner, and Ivan Vidangos. 2017. “Racial Gaps in Labor Market Outcomes in the Last Four Decades and over the Business Cycle.” Federal Reserve Board of Governors, Finance and Economics Discussion Series 2017-071.
Powell, Jerome H. 2021. “Getting Back to a Strong Labor Market.” Speech to the Economic Club of New York via webcast, February 10.
Opinions expressed in FRBSF Economic Letter do not necessarily reflect the views of the management of the Federal Reserve Bank of San Francisco or of the Board of Governors of the Federal Reserve System. This publication is edited by Anita Todd and Karen Barnes. Permission to reprint portions of articles or whole articles must be obtained in writing. Please send editorial comments and requests for reprint permission to research.library@sf.frb.org