
More than two years after the outbreak of COVID-19, concerns remain that U.S. businesses are substantially more vulnerable and less productive than in the past. Using extensive data on private and public firms allows for a detailed assessment of these concerns. According to a number of performance measures, businesses borrowing from large U.S. banks appear relatively healthy, increased leverage is concentrated among safer companies rather than riskier ones, and probabilities of default are close to pre-crisis levels.
After the outbreak of COVID-19 in March 2020, many U.S. firms faced an unprecedented decline in their cash flows, and their demand for additional credit sharply increased. Large-scale government interventions partly addressed those needs. However, more than two years after the outbreak, there are lingering concerns regarding the condition of U.S. businesses, as mentioned in recent reports by the International Monetary Fund (IMF 2022) and the Organisation for Economic Co-operation (OECD 2021). Among those, policymakers are concerned that businesses may be substantially less productive than they used to be, that more risky companies obtain credit more easily, and that indebted firms could pose a greater risk to U.S. banks and financial stability.
This Economic Letter assesses those concerns using extensive income and balance sheet data on U.S. businesses. The data are collected by large U.S. banks and include both private and public firms; they therefore cover a substantially larger portion of the overall business population than typical data sets. To detect changing patterns, I rank firms according to different indicators of business performance and assess the overall shifts in firm distributions over these measures between the end of 2019 and the end of 2021. Various measures show that U.S. businesses are relatively healthy. Compared with the state before the crisis, performance measures such as return on assets improved, which can in part be attributed to businesses paying lower interest rates on their debt. Ratios of debt to assets remained much the same, and any increases in leverage were concentrated among safer firms rather than riskier ones. Probabilities of default were close to their pre-crisis levels by the end of 2021.
Thus, the findings ease the concerns that U.S. businesses are less productive, that they are able to obtain riskier credit more easily, or that they pose a greater risk to banks and financial stability. Moreover, recent increases in debt maturities and historical experience suggest that firms are in a good position to adjust to rising interest rates.
Data on U.S. businesses
This Economic Letter uses data from the corporate loan schedule H.1 of the Federal Reserve’s Y-14Q data set. The data are collected for the purpose of stress-testing large U.S. banks and cover all commercial and industrial bank loans that are greater than $1 million. Apart from credit information, the data also include information on the balance sheets and income statements of each borrower. My analysis relies in large part on these financial reports from around 40,000 firms at each date. The majority are privately held firms that do not access the public capital market and thus are not covered by data sets like Standard & Poor’s (S&P’s) Compustat.
The data include numerous small- and medium-sized companies. For example, ordering them by total assets as of the end of 2019, the threshold is $859 million for the top 10% of the size distribution, $24 million for the top 50%, and $4 million for the bottom 10%. The broad data coverage allows for a thorough look at how the business population has changed over the past two years. One caveat is that this sample may not completely represent the overall firm population. The data set excludes the smallest businesses and only considers those that survived the pandemic and successfully obtained credit from large U.S. banks. The sample therefore naturally changes over the considered dates. Nonetheless, the snapshots at different points in time provide a useful comparison across groups.
Are businesses less productive since the pandemic?
I start by assessing whether companies are less productive now than they were before the pandemic. This concern comes from the possibility that companies were kept alive by the government’s credit programs or because banks “evergreened” loans, meaning they granted further credit to firms that were close to default to keep such firms alive (see discussion in Faria-e-Castro, Paul, and Sánchez 2021). To analyze how the health of firms over the COVID-19 crisis has evolved, I compare how company distributions shifted according to a number of indicators in the fourth quarters of 2019, 2020, and 2021.
Figure 1 shows the cumulative distributions at those dates according to firms’ return on assets—defined as net income relative to total assets—as a measure of firm productivity. Over the two years, the distribution shifted to the right, meaning that, relative to 2019, a larger mass of firms had progressively higher returns on assets in 2020 and 2021.
Figure 1
Return on assets for U.S. businesses, 2019–2021
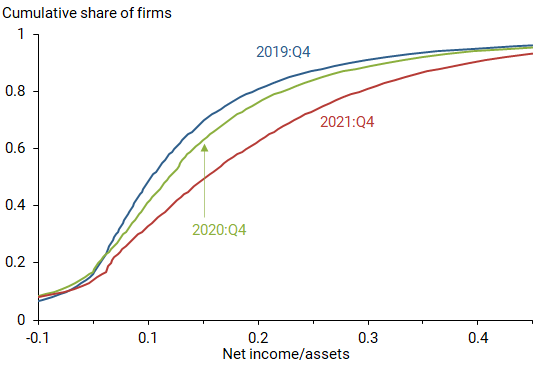
In further analysis, I find similar patterns for other performance measures, such as net income growth, sales growth, and interest coverage ratios, defined as earnings before interest, taxes, depreciation, and amortization (EBITDA) relative to interest expenses. According to these various indicators, U.S. firms borrowing from large banks appeared relatively healthy at the end of 2021. These findings suggest that the concern about business productivity two years after the outbreak of COVID-19 is unfounded.
One potential reason why these performance measures have improved is the substantial government interventions and accommodative monetary policy during the pandemic. Businesses were paying lower interest rates on loans, provided they were healthy enough to avoid a wider risk spread on their borrowing. Thus, the low interest rate environment may have translated into an overall reduction in the average interest rates paid by firms.
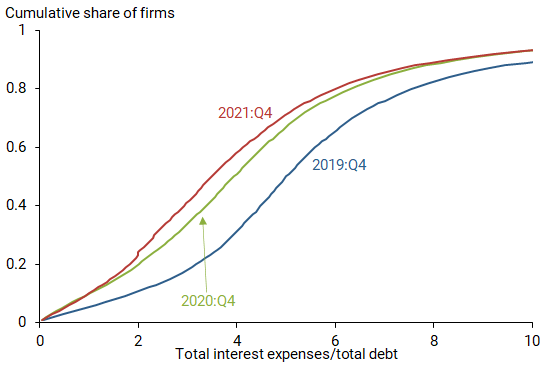
Figure 2 shows that this has been the case. The distribution according to average interest rates paid by firms, defined as total interest rate expenses over total debt, shifted strongly to the left. This implies that a larger mass of firms paid lower interest rates on their debt over time. Most of the reduction took effect in the fourth quarter of 2020, which may have helped firms reduce part of their costs over the first year of the pandemic. This reduction has been quantitatively important. For example, in 2019, around 40% of firms paid interest rates of 4.5% or less, whereas the same mass of firms paid 3.6% or less on their total debt in 2021. Total interest expenses are also quantitatively important relative to company profits. Over the dates of this study, the ratio of interest expenses to the sum of net income and interest expenses was around 10.5% for the median firm.
Figure 2
Average interest rates for U.S. businesses, 2019–2021
Is more credit going to riskier companies?
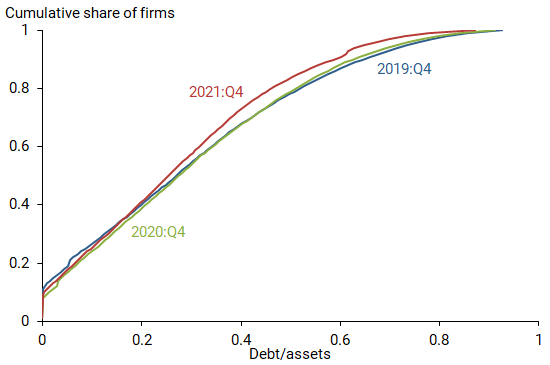
A second concern is that the expansionary monetary environment during the pandemic may have allowed businesses—especially more risky ones—to “leverage up” and take on more debt. Figure 3 shows that, contrary to this concern, the leverage distribution remained largely unchanged between 2019 and 2021. In further analysis, I split the sample into high-risk and low-risk firms according to their S&P rating, with low risk reflecting a rating of A or better. I find that, if anything, low-risk firms leveraged up more than higher-risk firms over the crisis years: the median low-risk firm at each date increased its leverage by more than 6 percentage points from the end of 2019 to the end of 2021, whereas the median high-risk firm decreased its leverage by around 3 percentage points over the same period. This surge in leverage of low-risk firms can be explained by the favorable conditions in the corporate bond market that persisted after the initial worsening during the early weeks of the pandemic (see, for example, Greenwald, Krainer, and Paul 2020). In contrast, high-risk firms—which tend to be smaller and do not issue corporate bonds—slightly decreased their leverage. These patterns argue against the concern that high-risk firms were easily able to obtain additional credit over the past two years.
Figure 3
Leverage among U.S. businesses, 2019–2021
Are businesses posing more risk to financial stability?
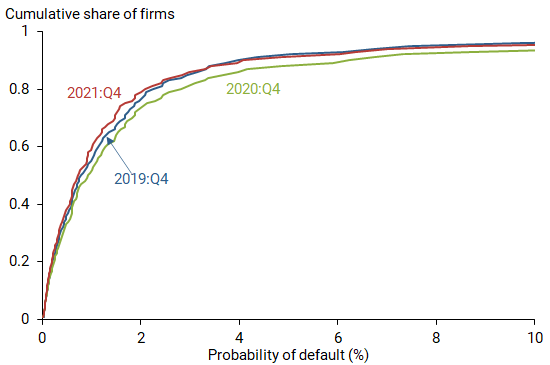
In answer to a final concern, Figure 4 provides evidence that the business credit risk exposure of large U.S. banks has remained very close to pre-pandemic conditions. The figure shows distributions according to companies’ probabilities of default based on bank risk assessments. That is, the probability of default estimates the likelihood that a loan will not be repaid in full or that the borrower will be sufficiently late on payments over the course of the next year; therefore, this is not a measure of firm bankruptcy. According to this metric, the distribution initially worsened but returned close to its pre-crisis level after two years.
Figure 4
Probabilities of default for U.S. businesses, 2019–2021
I find similar results by checking whether any of the patterns differ for specific business groups. For example, I compare sectors that have high contact versus low contact with customers. My data for high-contact sectors come from two-digit NAICS (North American Industry Classification System) codes for “Educational Services,” “Health Care and Social Assistance,” “Arts, Entertainment, and Recreation,” and “Accommodation and Food Services.” Across those subsamples, I find that the patterns are broadly similar to my earlier results. This also holds true when I limit my analysis to small versus large or private versus public companies.
Potential effects of tighter monetary policy on businesses
Finally, I draw on historical experience to investigate how a sequence of monetary tightening through higher interest rates may affect companies. From the fourth quarter of 2015 to the fourth quarter of 2019, the effective federal funds rate increased more than 2 percentage points. Using the same methodology as above, I find in the data that this increase led to a substantial rise in average interest rates that businesses paid to banks. For example, the average interest rate by the median company rose from around 4.2% in 2015 to more than 5% in 2019. However, I also find that their return on assets changed little, potentially because businesses anticipated the rate increases, which allowed them to adapt their operations in advance. Besides such an anticipation effect, firms may also be less affected by a shorter tightening episode if they have recently extended the maturity on their debt, reducing the portion of debt that has to be renewed over the near term. The median company at each date increased its ratio of long-term debt to total debt, where long-term debt is defined as having a maturity of one year or more, by around 2.5 percentage points from 2019 to 2021. This shift potentially makes firms less vulnerable to the current environment of rising interest rates.
Conclusion
In this Economic Letter, I used extensive data on private and public U.S. firms to assess their conditions two years after the outbreak of COVID-19. According to various performance measures, companies borrowing from large banks appear healthy, compared with their pre-pandemic state. One contributing factor is that the monetary accommodation during the pandemic substantially reduced their interest rate expenses. These findings ease concerns that firms are substantially less productive now than before the pandemic. Increased leverage is concentrated among low-risk firms, not high-risk firms. Finally, probabilities of default are close to their pre-crisis levels, which refutes the concern that business lending poses a greater risk to large U.S. banks and financial stability overall.
Pascal Paul is a senior economist in the Economic Research Department of the Federal Reserve Bank of San Francisco.
References
Faria-e-Castro, Miguel, Pascal Paul, and Juan M. Sánchez. 2021. “Evergreening.” FRB San Francisco Working Paper 2022-14.
Greenwald, Daniel, John Krainer, and Pascal Paul. 2020. “The Credit Line Channel.” FRB San Francisco Working Paper 2020-26.
IMF. 2022. “Private Sector Debt and the Global Recovery.” World Economic Outlook, Chapter 2, April.
OECD. 2021. OECD Economic Outlook, June, Paris: OECD Publishing.
Opinions expressed in FRBSF Economic Letter do not necessarily reflect the views of the management of the Federal Reserve Bank of San Francisco or of the Board of Governors of the Federal Reserve System. This publication is edited by Anita Todd and Karen Barnes. Permission to reprint portions of articles or whole articles must be obtained in writing. Please send editorial comments and requests for reprint permission to research.library@sf.frb.org