
Banks limit their interest rate risk exposure by issuing adjustable-rate loans and protect their funding costs by slowly adjusting deposit rates. These actions allow banks to maintain largely stable profit margins even if monetary policy tightens unexpectedly. Evidence from the pre-pandemic tightening cycle suggests that bank profit margins could increase rather than decline over the coming months. However, the slow adjustment of rates that banks pay on deposits may result in people moving their savings, leading to a reallocation of assets away from the regulated banking system.
With long-term fixed rate assets and short-term liabilities that have flexible rates, banks may be strongly exposed to interest rate risk. Accordingly, when monetary policy tightens and short-term interest rates increase, banks’ funding costs would rise while their profit margins would shrink, dragging down their equity valuations. This Economic Letter assesses this kind of interest rate risk exposure among U.S. banks, addressing concerns that the current episode of monetary policy tightening could put strong financial pressure on them.
Banks can structure their balance sheets to reduce their interest rate risk exposure. On the asset side of their balance sheets, banks frequently issue business loans or household mortgages with adjustable rates. On the liability side, banks’ funding costs do not necessarily move one-for-one with changes in short-term rates, which means interest rates that banks pay on deposits are inherently rigid. Given these features, I show that the majority of U.S. bank holding companies have relatively more assets than liabilities that reprice within a year, a so-called positive income gap. Over recent decades, bank net interest margins have therefore been relatively stable despite large fluctuations in short-term rates.
Nevertheless, banks cannot offload all interest rate risk. For instance, while variable-rate loans and rigid deposit rates reduce their exposure, banks’ net interest margins still decline following unexpected increases in short-term policy rates, though this pass-through is muted. This relation may reverse after a long period of low interest rates, as happened during the pre-pandemic tightening episode: bank profit margins increased in part because deposit rates were held down when policy rates rose from their lower bound. This experience and the latest data suggest that profit margins could behave similarly over the current monetary policy tightening cycle.
Still, in response to tighter policy, lower rates paid on deposits result in some liquid bank deposits flowing out of the regulated commercial banking system into the shadow banking system. This suggests the stability of bank profit margins is associated with a reallocation of deposits and assets within the financial system away from the regulated banking sector when policy rates rise.
How sensitive are banks’ assets and liabilities to changes in interest rates?
If deposit rates rise one-for-one with the federal funds rate and banks’ long-term assets are assumed to have fixed rates, then a monetary tightening would be expected to lead to a decline in banks’ net interest rate margins. To begin assessing this view, I consider the flexibility of rates for bank liabilities and assets using Y-9C data for U.S. bank holding companies (BHCs). These data contain information on the value of book assets and liabilities that reprice or mature within the next year. Using these data, the one-year income gap for a BHC at a particular point in time is the difference between those assets and liabilities, relative to total bank assets.
The income gap therefore approximates the extent to which a bank’s net interest income is sensitive to changes in interest rates. The advantage of this measure is that the data apply to all interest-earning assets and liabilities of a BHC. Figure 1 shows the density of the income gap across all BHCs in the fourth quarter of 2021, so before the Federal Reserve started lifting interest rates. The figure shows that most BHCs have a positive income gap. That is, more of their assets than liabilities reprice within the next year, stemming from the large fraction of adjustable-rate loans that banks hold (Gomez et al. 2021).
Figure 1
Income gap of bank holding companies
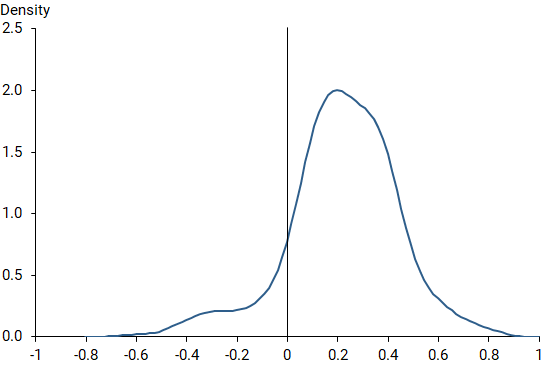
Source: Board of Governors Y-9C reports.
The income gap excludes noninterest-bearing liabilities and savings deposits since those tend to carry rates that are historically slow to adjust to policy rate changes. However, even when imposing the strong assumption that all such liabilities reprice within a year, I find that the average income gap across all BHCs is close to zero, which contrasts with the expected strongly negative income gap if all bank assets were long-term loans with fixed rates.
Responses of bank net interest margins to monetary policy shocks
While the income gap is a useful indicator of banks’ interest rate risk exposure, it is an incomplete measure of how bank profit margins react to interest rate changes. For example, the cost of new borrowing is not taken into account after a bank’s liabilities mature. To investigate how bank profit margins respond to policy rate changes, I first need a way to measure unexpected movements in interest rates. For these monetary policy surprises, I use high-frequency changes of federal funds futures prices around the time of Federal Reserve policy announcements, following the computations by Nakamura and Steinsson (2018). I estimate the response of U.S. banks’ net interest margins (NIMs)—the difference between interest income and expenses relative to interest-earning assets—to these surprises. Figure 2 shows the estimation results for the sample from 1994 through 2007, along with shading to indicate accuracy within 68% and 95% confidence intervals.
Figure 2
Response of net interest margins to monetary tightening
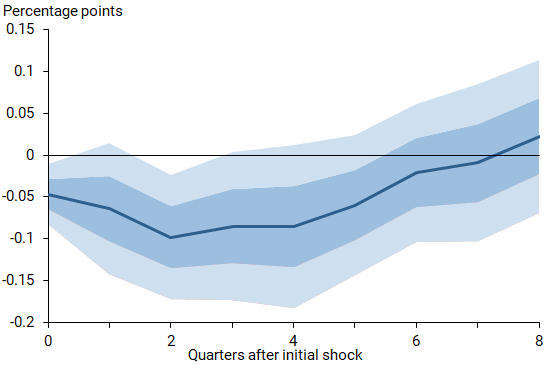
Source: Author’s calculations.
Note: Responses over 1994-2007 sample period. Shaded areas indicate the 68% and 95% confidence bands.
A monetary policy tightening shock that raises the federal funds rate by 1 percentage point (100 basis points) after one year predicts a decline in bank NIMs of about 0.1 percentage point (10 basis points) over the same horizon. Thus, while NIMs decline, the pass-through to bank profit margins is muted, and banks are able to offload a substantial portion of the interest rate risk they are naturally exposed to.
Historical evolution of bank profit margins
The previous evidence suggests that bank profit margins should be relatively stable even when short-term policy rates rise or fall substantially. To investigate whether this has been the case, I turn to data from Bank Call Reports. Figure 3 shows the historical evolution of various bank profit margins over recent decades, with values normalized by total assets for ease of comparison. Several observations stand out.
Figure 3
Bank profit margins
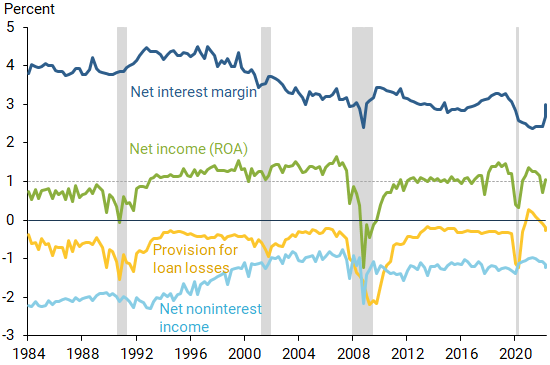
Source: Bank Call Reports and author’s calculations.
Note: Bank profit margins over 1984:Q1-2022:Q3 sample. Gray shading indicates NBER recession periods.
First, overall bank NIMs are relatively stable despite large fluctuations in the federal funds rate over the sample period. Thus, banks are able to match the sensitivity of their interest income and expenses to changes in the federal funds rate (Drechsler et al. 2021). However, NIMs also declined substantially over recent decades, by around 2 percentage points from the early 1990s to their recent low levels. In Paul (2022), I found that this decline coincides with the fall in the term premium, a compensation for bearing interest rate risk. The comovement between the two series again suggests that banks cannot offload all interest rate risk but have historically been compensated for such risk exposure.
Second, banks’ return on assets (ROA), a financial ratio to indicate profitability, measured as net income relative to total assets, has also been relatively stable outside of recessions at around 1% (highlighted by the dashed gray line in Figure 3). Note that ROA is the sum of net interest margins, net noninterest income, provision for loan losses, and other smaller income items. During recessions, provisions for loan losses increase, dragging down bank ROAs.
Third, net noninterest income rose over recent decades due to reductions in the cost of banking operations, which helped banks stabilize their ROAs while NIMs declined.
And fourth, NIMs and ROAs increased over the pre-pandemic tightening cycle that started in 2015. That is because, when the federal funds rate moved up, banks strongly held down deposit rates following a long period when policy rates were stuck at their effective lower bound. This recent experience suggests that bank profit margins may not be affected much by the current ongoing rise in interest rates, which also follows an episode of low policy rates. In fact, the latest data points for the third quarter of 2022 in Figure 3 show an increase in NIMs and ROAs over the previous two quarters.
Deposit flows and asset reallocations within the financial system
How do depositors react when policy rates move up and deposit rates are held down? To provide an answer to this question, I again use the monetary policy shock measure, but this time I consider the response of liquid transaction deposits, such as those associated with a checking account, to monetary tightening shocks.
Figure 4 shows the response of liquid deposits to a monetary policy tightening shock for the sample period of 1994-2007. The response is strongly negative, with liquid deposits declining around 5% after six quarters. Thus, rate-sensitive depositors move their funds when the opportunity cost of holding such deposits increases.
Figure 4
Responses of bank deposits to monetary tightening
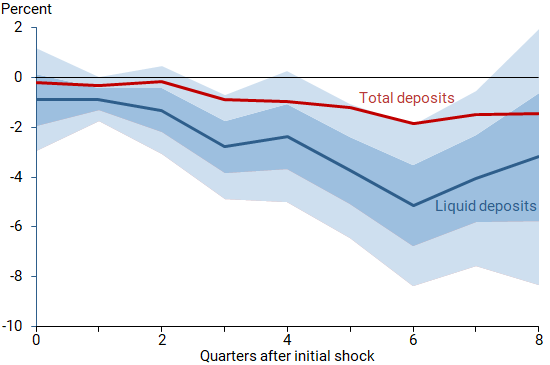
Source: Author’s calculations.
Note: Responses over 1994-2007 sample period. Shaded areas indicate the 68% and 95% confidence bands.
Where do these deposits end up? Depositors move their funds to places where they can earn higher returns on their investments, at the potential cost of liquidity and safety. For example, some of the liquid deposits remain with the banking sector and are exchanged for less-liquid deposits, such as traditional certificates of deposit or term deposits. However, as the red line in Figure 4 shows, total bank deposits still decline to a monetary policy tightening shock, illustrating that depositors also search for other investments. In accordance with this finding, the most recent data for U.S. banks show that total bank deposits fell around $575 billion between the first quarter and third quarter of 2022.
Apart from illiquid term deposits, investors may move their funds to government securities or money market funds. While money market deposits are not government insured, they typically offer higher rates than bank demand deposits, while still being highly liquid. Consistent with this explanation, in earlier research (Paul 2018) I found that the yearly percentage growth of assets held by money market funds and the level of the federal funds rate tend to move together very closely.
Money market funds are an important source of funding for shadow banks, which gives these institutions an easy way to expand their lending relative to regulated commercial banks following a tightening of monetary policy (Elliott et al. 2021). Thus, when policy interest rates change, deposits and assets tend to be reallocated within the financial system. After tighter policy, relatively less lending comes from the regulated and supervised commercial banking system and more from the potentially less stable shadow banking system.
Conclusion
This Economic Letter provides evidence that commercial banks are able to offload a large part of their interest rate risk exposure. Following monetary policy tightening shocks, bank profit margins typically decline somewhat. However, during the pre-pandemic episode of tightening, banks’ net interest margins instead increased, as deposit rates were held down after a long period of policy rates being stuck at their lower bound. This recent experience suggests that bank profit margins could behave similarly over the ongoing tightening cycle. The stability of bank profit margins is achieved in part via relatively large deposit outflows and asset reallocations within the financial system. After a monetary tightening, liquid deposits flow out of the regulated banking system, allowing money market funds to grow and possibly providing additional funding for shadow banks.
Pascal Paul is a senior economist in the Economic Research Department of the Federal Reserve Bank of San Francisco.
References
Drechsler, Itamar, Alexi Savov, and Philipp Schnabl. 2021. “Banking on Deposits: Maturity Transformation without Interest Rate Risk.” Journal of Finance 76(3), pp. 1,091–1,143.
Elliott, David, Ralf Meisenzahl, José-Luis Peydró, and Bryce C. Turner. 2021. “Nonbanks, Banks, and Monetary Policy: U.S. Loan-Level Evidence since the 1990s.” FRB Chicago Working Paper 2022-27 (June).
Gomez, Matthieu, Augustin Landier, David Sraer, and David Thesmar. 2021. “Bank Exposure to Interest-Rate Risk and the Transmission of Monetary Policy.” Journal of Monetary Economics 117, pp. 543–570.
Nakamura, Emi, and Jon Steinsson. 2018. “High Frequency Identification of Monetary Non-Neutrality: The Information Effect.” Quarterly Journal of Economics 133(3), pp. 1,283–1,330.
Paul, Pascal. 2022. “Banks, Maturity Transformation, and Monetary Policy.” FRB San Francisco Working Paper 2020-07, October, forthcoming in Journal of Financial Intermediation.
Paul, Pascal. 2018. “Monetary Policy Cycles and Financial Stability.” FRBSF Economic Letter 2018-06 (February 26).
Opinions expressed in FRBSF Economic Letter do not necessarily reflect the views of the management of the Federal Reserve Bank of San Francisco or of the Board of Governors of the Federal Reserve System. This publication is edited by Anita Todd and Karen Barnes. Permission to reprint portions of articles or whole articles must be obtained in writing. Please send editorial comments and requests for reprint permission to research.library@sf.frb.org