
How well the economy is progressing toward the Federal Reserve’s goal of maximum employment is reflected in a range of indicators that evolve over time. Beyond the unemployment rate, two key metrics of labor market health are the labor force participation rate and the employment-to-population ratio. The aging of the population is reducing the levels of both measures, implying that they are unlikely to return to pre-pandemic highs. However, these two indicators remain well below their demographic trends, and analysis suggests that they will not recover to trend until 2024.
The Federal Reserve’s mandate includes a commitment to “maximum employment.” As described in the Fed’s monetary policy strategy, this is “a broad-based and inclusive goal that is not directly measurable and changes over time” (Board of Governors 2021). Moreover, it is not captured by any single indicator such as the unemployment rate but instead reflects assessments of a wide range of indicators (see, for example, Gilchrist and Hobijn 2021). Two key indicators are the labor force participation (LFP) rate, which measures the fraction of the working-age population age 16 and older that is employed or unemployed (without a job and actively looking for one), and the employment-to-population ratio (EPOP), which excludes unemployed individuals.
The record-setting economic expansion that was derailed by the COVID-19 pandemic demonstrated the importance of using both a broad definition of maximum employment and multiple indicators to assess progress toward the Fed’s goal. During the second half of 2019 and early 2020, the unemployment rate had settled near 3.5%, a 50-year low. At the same time, the LFP rate and EPOP continued a slow but steady rise. These indicators’ improvement despite inflation remaining below the Fed’s 2% goal suggests that further labor market gains may have been sustainable. Moreover, LFP and EPOP continued to rise despite the downward pressure from the aging of the large baby-boom generation, which keeps the retirement rate elevated.
Sorting through these elements of maximum employment has become especially important as the labor market recovers from the massive dislocation created by the pandemic. In this Economic Letter, we assess the moving target of maximum employment by examining potential paths for the LFP rate and EPOP relative to their underlying trends, which are largely determined by population demographics. Both series are well below trend, suggesting that the labor market is short of the Fed’s maximum employment goal, despite very strong labor market conditions that partly reflect pandemic-related employment constraints.
LFP, EPOP, and maximum employment
The unemployment rate provides a partial measure of the labor supply, as reflected in jobless individuals actively searching for work. The LFP rate and EPOP provide additional information on labor supply and labor market conditions by including individuals who are employed, thus providing useful insights on where the labor market is relative to maximum employment. The two series are closely related: EPOP is entirely determined by the LFP rate, scaled down by the unemployment rate. Discussions of labor market conditions relative to maximum employment often invoke the LFP rate or EPOP, sometimes for population subgroups such as prime-age individuals (for example, Daly 2021). More favorable labor market conditions generally are associated with high values of both series. However, neither is adequate on its own, and they provide complementary information. For example, an elevated LFP rate may obscure a weak labor market when unemployment also is high; in this case, EPOP will be low, accurately suggesting a shortfall from maximum employment.
Figure 1 shows both series have trended downward over the past few decades. The decline accelerated in the aftermath of the Great Recession of 2007–09. While weak labor market conditions likely contributed, population aging has been the key factor pulling the LFP rate and EPOP down since 2010. Because older individuals, especially those over age 65, have systematically lower participation rates than younger individuals, their rising share of the population mechanically reduces the overall LFP rate. This relationship holds even if the LFP rate for older individuals is rising: the downward pressure of aging on LFP simply requires lower average LFP rates for older individuals. Put differently, the wave of retirements that began when the large baby-boom generation started reaching age 65 has exerted a persistent downward pull on overall LFP and EPOP.
Figure 1
Labor force participation and employment-to-population ratio
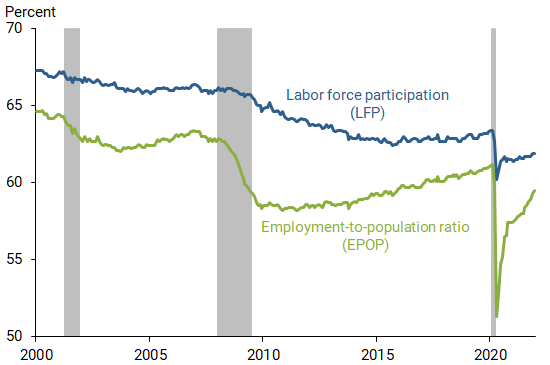
Source: U.S. Bureau of Labor Statistics; data for working-age population age 16 and older. Gray shading indicates NBER recession dates.
Figure 2 illustrates the downward pull of aging on the LFP rate by depicting how much of the nonparticipant population is retired. This fraction had been rising steadily since 2010, but it accelerated early in the pandemic. The recent retirement surge likely reflects the initial hit to the labor market, combined with workplace health concerns over COVID that are especially acute for older individuals and the strong stock market that bolstered many retirement wealth portfolios. Even if these unique pandemic-related factors fade, however, ongoing population aging and retirements will continue to pull down the underlying LFP and EPOP trends.
Figure 2
Retired individuals as a share of labor force nonparticipants
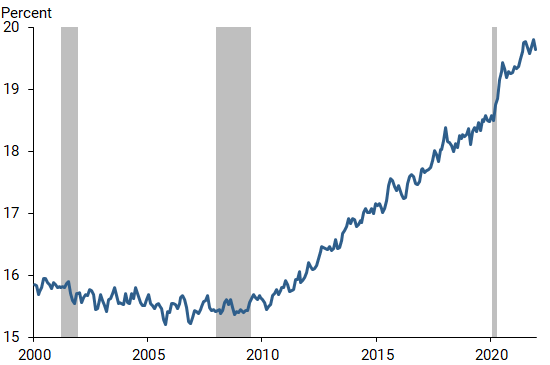
Source: Authors’ calculations from Current Population Survey microdata. Gray shading indicates NBER recession dates.
One element weighing against the downward pull of aging on LFP and EPOP is a consistent cyclical upswing during economic recoveries. In particular, Figure 1 shows that LFP and EPOP both recovered somewhat during the five years before the 2020 pandemic recession, consistent with a “participation cycle,” or lagged response of participation to continued labor market tightening (Hobijn and Şahin 2021). This largely reflects a substantial bounce back in participation for individuals in their prime working ages of 25–54 (Daly 2021). However, this cyclical contribution did not fully offset the downward pull of aging, and hence the overall LFP and EPOP during the pre-pandemic expansion did not reach their prior peaks.
More recently, LFP and EPOP both plunged when the pandemic crisis began in early 2020, with an initial sharp recovery later in 2020 followed by little change in 2021. Understanding where the labor market is relative to the Fed’s maximum employment goal requires assessing what to expect for these indicators over the next few years.
Shifting maximums
Given the uneven retirement patterns during the pandemic, and in LFP and EPOP more generally, it is important to uncover their underlying trends to assess what to expect for their future levels. The rising population share of retired individuals is projected to persist beyond 2030, as baby boomers continue to age. This will continue to pull down LFP and EPOP, offset to some degree by the participation cycle.
Various methods to estimate the downward pull of shifting demographics on the aggregate LFP rate (see discussion in Hornstein, Kudlyak, and Schweinert 2018) end up with similar results: they all find that overall LFP has been pulled down roughly 0.25 percentage point annually due to the aging of the population in recent years.
We measure this demographic drag on LFP using a straightforward “shift-share” analysis. Specifically, we assume that LFP rates for seven age groups by gender (14 groups total) remain fixed at their early 2020 pre-pandemic peak values. We calculate the demographic trend in the overall LFP rate by weighting each group’s LFP by its projected population share, using annual Census Bureau population projections and interpolating to obtain quarterly values. For the trend EPOP rate, we combine the LFP trend projection with an unemployment rate of 3.5%, which is the low reached during the pre-pandemic expansion. This represents a slightly optimistic assumption for maximum employment for two reasons. First, LFP rates by age group may not reach their pre-pandemic peaks. And second, most estimates of the natural rate of unemployment—the lowest sustainable level of unemployment—are closer to 4%, including the San Francisco Fed’s estimate of 3.8%.
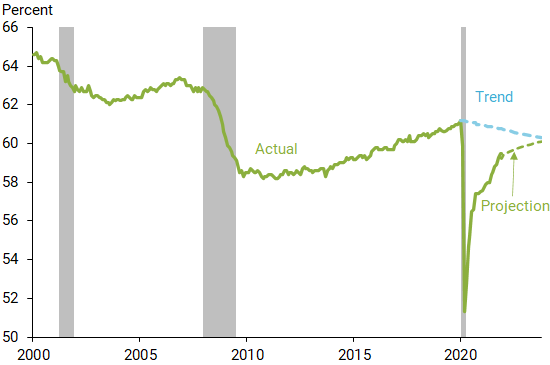
Figures 3 and 4 show the resulting LFP and EPOP trend lines. In Figure 3, the LFP trend falls 0.25 percentage point per year from 2020 through 2023, consistent with prior estimates. The actual value of LFP in recent months is about 1 percentage point below trend, representing over 1.5 million potential workers. Figure 4 shows similar patterns for EPOP.
Figure 3
Labor force participation: Actual and trend
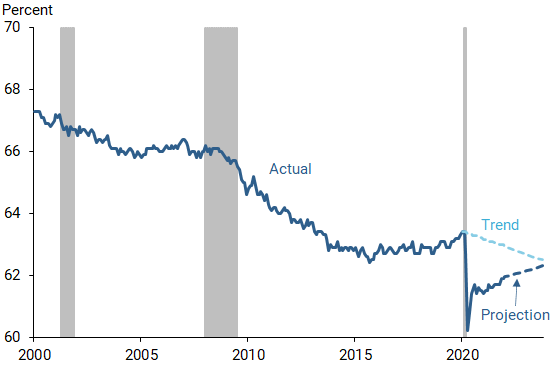
Source: U.S. Bureau of Labor Statistics and authors’ calculations. Gray shading indicates NBER recession dates.
Figure 4
Employment-to-population ratio: Actual and trend
Source: U.S. Bureau of Labor Statistics and authors’ calculations. Gray shading indicates NBER recession dates.
The demographic trend lines can be thought of as representing values of LFP and EPOP that are consistent with maximum employment. Eventually attaining these values will depend on whether and how quickly the actual values rise to meet trend. After the sharp rebound following the initial stage of the pandemic in 2020, LFP has changed little, and the normal participation cycle suggests that its full recovery will lag the unemployment rate recovery (Hobijn and Sahin 2021). This lagged adjustment may be particularly pronounced coming out of the pandemic, especially for women, due to ongoing childcare challenges (Lofton, Petrosky-Nadeau, and Seitelman 2021).
Given these uncertainties, we use a simple projection based on the patterns in the pre-pandemic expansion. Between the second quarter of 2018, when the unemployment rate reached its December 2021 level of 3.9%, and late 2019, when it settled at 3.5%, the overall LFP rate rose 0.4 percentage point. Projecting the same increase from now until the second half of 2023, when the San Francisco Fed’s forecast projects the unemployment rate will settle at 3.5%, implies that the actual LFP rate will not reach its trend value until after the projection period, likely in 2024.
Figure 4 shows a similar projection for EPOP, combining the LFP path and unemployment rate forecast just noted. Like the LFP rate, EPOP in this projection also is likely to reach its trend value in 2024.
There are risks that actual convergence could occur slower or faster than these projections, beyond the general risks to the pace of overall economic growth. Retirement rates may remain unusually elevated. Also, given how families have adapted to schooling and childcare challenges during the pandemic, it is not clear when or if prime-age labor force nonparticipants will return to the labor market, especially for women (Lofton et al. 2021). On the other hand, if the pandemic is the primary constraint facing potential workers, further virus containment could help participation bounce back faster than projected here.
Conclusion: Still a ways to go
Our analysis of the LFP rate and EPOP suggests that these indicators are still significantly below their demographic trend values that are consistent with long-run maximum employment. Combining the downward trend in both series with their likely slow adjustment to a tighter labor market suggests that both will reach their long-run maximum employment levels in 2024.
In the meantime, other labor market signals currently are very strong, including low unemployment, record job openings and quits, extensive worker shortages, and consequent faster wage growth. These indicators suggest a labor market that is already very close to maximum employment, conditional on labor market constraints arising from the pandemic. However, our analysis suggests that achieving the labor market’s longer-term potential may require a few more years of expansion.
Sarah Albert is a research associate in the Economic Research Department of the Federal Reserve Bank of San Francisco.
Robert G. Valletta is the associate director of research in the Economic Research Department of the Federal Reserve Bank of San Francisco.
References
Board of Governors of the Federal Reserve System. 2021. “Statement on Longer-Run Goals and Monetary Policy Strategy.” January 26.
Daly, Mary C. 2021. “What Is Full Employment?” SF Fed Blog, August 3.
Gilchrist, Troy, and Bart Hobijn. 2021. “The Divergent Signals about Labor Market Slack.” FRBSF Economic Letter 2021-15 (June 1).
Hobijn, Bart, and Ayşegül Şahin. 2021. “Maximum Employment and the Participation Cycle.” Paper presented at the 2021 Jackson Hole Economic Policy Symposium.
Hornstein, Andreas, Marianna Kudlyak, and Annemarie Schweinert. 2018. “The Labor Force Participation Rate Trend and Its Projections.” FRBSF Economic Letter 2018-25 (November 19).
Lofton, Olivia, Nicolas Petrosky-Nadeau, and Lily Seitelman. 2021. “Parental Participation in a Pandemic Labor Market.” FRBSF Economic Letter 2021-10, April 5.
Opinions expressed in FRBSF Economic Letter do not necessarily reflect the views of the management of the Federal Reserve Bank of San Francisco or of the Board of Governors of the Federal Reserve System. This publication is edited by Anita Todd and Karen Barnes. Permission to reprint portions of articles or whole articles must be obtained in writing. Please send editorial comments and requests for reprint permission to research.library@sf.frb.org