

Different ways of measuring the economy’s unused capacity, or slack, can result in varying inflation forecasts. Estimates suggest that direct measures of labor market tightness, such as the ratio of job vacancies to unemployment or the rate of employee job switching, provide more accurate forecasts than commonly used measures, such as the unemployment rate or the output gap. Recent elevated values of these measures of labor market tightness suggest greater inflation pressure than is implied by the unemployment rate alone.
Understanding how inflation responds to economic conditions is important for monetary policymakers. The main framework to explain inflation dynamics, known as the Phillips curve, links inflation to the amount of unused production capacity in the economy. The underlying intuition is that, as the economy heats up, demand can exceed capacity, causing upward pressure on prices and thus higher inflation. In other words, inflation rises as the amount of economic “slack” falls.
Although the concept of slack may seem straightforward, finding the best proxy to measure it is notoriously difficult. In this Economic Letter, we systematically study the inflation forecasting accuracy of a large set of slack measures. We assess traditional measures of slack, such as the unemployment rate and output gap, along with more recently proposed labor market measures. We find that direct measures of the degree of labor market tightness, such as the vacancy-to-unemployment ratio (Barnichon, Oliveira, and Shapiro 2021) and job-switching rates (Moscarini and Postel-Vinay 2017), provide superior inflation forecasts for prices and wages. Our analysis suggests that these types of labor market tightness measures should be incorporated when assessing future inflation risk.
A plethora of slack measures
We compare nine different measures of slack that researchers have considered to be good proxies for inflationary pressures. We first consider labor market-based measures of slack because the cost of labor can drive up price inflation. This reflects that, as the economy expands, the number of individuals without a job, or the available supply of labor, declines. The resulting tight labor market makes firms compete more for workers such that a low unemployment rate will capture upward pressure on wages and, in turn, inflation. Our baseline slack measure is thus the unemployment rate, defined as the number of individuals actively looking for work relative to the size of the labor force. We view the unemployment rate as an appropriate baseline because it is one of the most widely tracked aggregate economic indicators and is commonly used in Phillips curve estimations.
For all of the slack measures discussed in this analysis, we remove variation related to longer-run trends, which leaves short-term fluctuations related to the business cycle. Figure 1 shows the statistical relationships of eight additional slack measures to the baseline unemployment rate over the 1995–2021 period, expressed as percentages. These correlations capture the strength of the relationship between the slack measure and the baseline, with 100% indicating that the two move together perfectly.
Figure 1
Correlation between slack measures and unemployment
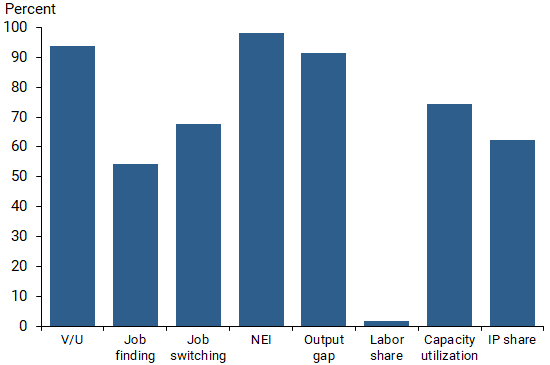
Source: Authors’ calculations; see text for data sources and descriptions.
One potential drawback of using the unemployment rate to measure slack is that it ignores workers outside of the labor force. Research shows that these workers tend to return to the labor market at certain phases of the business cycle (Hobijn and Şahin 2021). If nonparticipants return to the labor force during times of strong economic growth, they could reduce upward wage and price pressures by increasing the supply of workers available. In this case, the unemployment rate would overstate inflationary pressures. To address this limitation, Hornstein, Kudlyak, and Lange (2015) proposed an extended concept of unused labor. Their “non-employment index” (NEI) includes potential job seekers outside of the labor force, which accounts for potential cyclical fluctuations in the size of the labor force.
Another potential drawback of the unemployment rate as a measure of slack is that it does not directly account for the cost of labor. If businesses base their pricing decisions on their costs of expanding production, then the cost of hiring an additional worker could capture that inflationary pressure. Galí and Gertler (1999) were the first to argue that an approximation of the marginal cost of labor at the aggregate level could be used as a proxy for slack in a Phillips curve framework. They proposed using the share of output going to labor compensation, known as the “labor share.” While the labor share is straightforward and easy to construct, it measures the average cost of labor, not the more relevant marginal cost of labor.
The marginal cost of labor should approximate the relative cost of finding and hiring an additional worker. Because this cost generally increases when the demand for labor is high and the supply of available workers is low, a good proxy for marginal cost could be the vacancy-to-unemployment (V/U) ratio (Barnichon et al. 2021). The ratio represents the number of job vacancies, or demand for labor, relative to the number of unemployed individuals, or supply of labor.
Other studies propose using more precise measures of the cost of labor related to the bargaining position of workers. Moscarini and Postel-Vinay (2017) argued that the job-finding rate—the probability that an unemployed worker becomes employed—approximates the ease with which job seekers find jobs and therefore the strength of their bargaining position in wage negotiations. A high job-finding rate indicates a tight labor market in which workers can extract a higher wage from firms, which would ultimately lead to higher prices. Moscarini and Postel-Vinay (2017) also argued that the job-switching rate—the probability that an employed worker switches jobs—similarly approximates the ability of workers to extract higher wages.
While the cost of labor can drive up price pressures, it is not the only input of production for businesses. Raw materials, machines, and other types of capital infrastructure also play an important role. Similar to labor costs, increases in the cost of these inputs may force businesses to raise prices for their products to stay profitable. In this context, we consider two additional measures of slack based on industrial production. One is the Federal Reserve Board’s measure of capacity utilization, which measures the fraction of resources used to produce goods in manufacturing, mining, and electric and gas utilities. The second measure is the industrial production (IP) share, or the share of output in the economy attributable to industrial production, as proposed in Shapiro (2008). These two measures capture the theory that material inputs, such as primary metals, wood, and machinery, become relatively more costly during an economic expansion. Finally, for completeness we also assess the level of total output as measured by real GDP, or what is known as the “output gap” when constructed as the deviation from its long-run level, as a measure of slack. Real GDP captures the value of all goods and services produced in the economy and therefore represents a much broader metric of overall economic activity and price pressures than the other slack measures in our analysis.
The correlations of these measures to the unemployment gap, as shown in Figure 1, range from less than 5% for the labor share to more than 95% for the extended definition of unemployment in the NEI. Overall, this wide range of results relative to the baseline suggests that there is substantial variation across the different measures.
A horse race
We run a horse race between the nine measures of slack to assess which is the most accurate in forecasting price inflation. Specifically, we estimate a standard Phillips curve model to analyze how next year’s inflation relates to a current slack measure, while accounting for last year’s inflation as well as next year’s expected inflation as measured by the University of Michigan’s survey of consumer sentiments. We estimate the model using a 10-year rolling window over 1
995–2021—the time frame for which all slack measures are available—and we create a one-year-ahead forecast following the last date in each rolling sample. For each measure, we then calculate the forecast errors, which are the differences between their predicted values of inflation and actual inflation values. We measure overall forecasting performance using the mean of the squared values of these forecasting errors.
Figure 2 plots the mean-squared forecast errors of the different slack measures in predicting core personal consumption expenditures (PCE) price inflation one year ahead over 2005–2021. A smaller error indicates that the predicted measures of inflation are closer to the actual rates of inflation and hence shows better forecasting performance. The forecast errors are expressed in percentage terms relative to the baseline performance of the unemployment rate (green bar); thus, they can be interpreted as indicating how much better or worse they perform than the unemployment rate.
Figure 2
Performance of slack measure forecasts: Core PCE
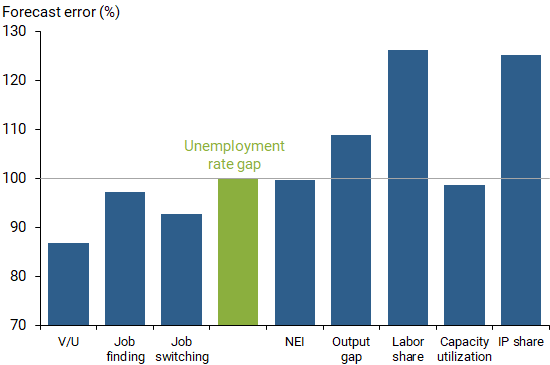
Note: Forecast errors measured relative to performance of unemployment.
Source: Authors’ calculations; see text for data sources and descriptions.
Our results show that the labor market indicators perform well compared to the other measures. In particular, the V/U ratio outperforms the traditional unemployment rate by about 15%, a large improvement when it comes to forecasting inflation. The job-finding and job-switching measures also outperform the unemployment rate, albeit to a more modest degree. The NEI and the output gap perform about the same as the unemployment rate, while the two share-based measures of slack, labor share and IP share, produce the least accurate forecasts.
We run a similar horse race between slack measures in forecasting wage inflation one year ahead, with wages measured as average hourly earnings. Recall that many of these slack indicators are designed to measure labor market tightness and hence wage pressures. Figure 3 plots the mean-squared forecast errors across all the slack measures and shows that the V/U ratio and the job-switching rate both substantially outperform the unemployment rate in predicting wage inflation. The share-based measures again perform relatively poorly.
Figure 3
Performance of slack measure forecasts: Wage inflation
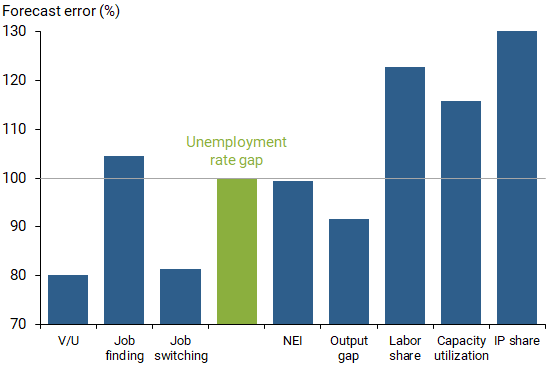
Note: Forecast errors measured relative to performance of unemployment.
Source: Authors’ calculations; see text for data sources and descriptions.
Conclusion
Overall, our analysis shows that proxies constructed to measure labor market tightness, particularly the vacancy-to-unemployment ratio and the job-switching rate, provide the most accurate forecasts of future price and wage pressures among the measures we test.
These results suggest that measures of labor market tightness should be considered reliable indicators of economic slack in the inflation dynamics toolbox. In the current environment, for example, although the unemployment rate has not reached its past lows, the V/U ratio has climbed to record highs. Based on our analysis, current inflationary risk is therefore higher when looking through the lens of the V/U ratio than when using the unemployment rate (Barnichon et al. 2021).
Regis Barnichon is a senior research advisor in the Economic Research Department of the Federal Reserve Bank of San Francisco.
Adam Hale Shapiro is a vice president in the Economic Research Department of the Federal Reserve Bank of San Francisco.
References
Barnichon, Regis, Luiz Oliveira, and Adam Shapiro. 2021. “Is the American Rescue Plan Taking Us Back to the ’60s?” FRBSF Economic Letter 2021-27 (October 18).
Galí, Jordi, and Mark Gertler. 1999. “Inflation Dynamics: A Structural Econometric Analysis.” FRBSF Economic Letter 44(2, October), pp. 195–222.
Hobijn, Bart, and Ayşegül Şahin. 2021. “Maximum Employment and the Participation Cycle.” NBER Working Paper W29222.
Hornstein, Andreas, Marianna Kudlyak, and Fabian Lange. 2015. “Measuring Resource Utilization in the Labor Market.” FRB Richmond Economic Quarterly 2015:Q1.
Moscarini, Giuseppe, and Fabien Postel-Vinay. 2017. “The Relative Power of Employment-to-Employment Reallocation and Unemployment Exits in Predicting Wage Growth.” American Economic Review 107(5), pp. 364–368.
Shapiro, Adam. 2008. “Estimating the New Keynesian Phillips Curve: A Vertical Production Chain Approach.” Journal of Money, Credit, and Banking 40(4, June), pp. 627–666.
Opinions expressed in FRBSF Economic Letter do not necessarily reflect the views of the management of the Federal Reserve Bank of San Francisco or of the Board of Governors of the Federal Reserve System. This publication is edited by Anita Todd and Karen Barnes. Permission to reprint portions of articles or whole articles must be obtained in writing. Please send editorial comments and requests for reprint permission to research.library@sf.frb.org