
Supply and demand imbalances associated with the COVID-19 pandemic have contributed to a sharp increase in price inflation since early 2021. In response, market-based measures of short-term inflation compensation have risen sharply in the United States. Survey-based measures suggest that this has not affected longer-term inflation expectations. However, analyzing the difference between market prices of standard and inflation-indexed government bonds provides tentative indications that investors have raised their 10-year inflation expectations since spring 2021 to levels above their historical range.
Inflation has risen substantially in the United States since early 2021, driven in part by unique factors related to the COVID-19 pandemic. These factors include labor shortages and supply bottlenecks, which have combined with heightened demand to produce unusually rapid wage and price increases (Shapiro 2022). More recently, the war in Ukraine has intensified the upward pressures on global commodity prices.
In this Economic Letter, I assess whether recent higher inflation is causing businesses and households to expect inflation to remain high over the longer run. I focus on what rising market-based measures of inflation compensation since spring 2021 may imply about bond investors’ outlook for inflation. They could reflect three factors: an increase in investors’ inflation expectations, an uptick in the premium investors demand for assuming inflation risk, or changes in other risk and liquidity premiums. I investigate the relative importance of each using a dynamic term structure model of nominal and inflation-adjusted yields at the 10-year horizon. Although model estimates include some uncertainty over longer-run forecasts, my results suggest that investors appear to have raised their long-term inflation expectations notably above their historical range for the past quarter-century. They were roughly offset by inflation risk premiums declining from elevated levels to near the historical average. This may suggest that investors view the current risks to their expected inflation outlook as having little bias in either direction. By comparison, professional forecasters have not adjusted their long-term inflation forecasts as much. It will be important to monitor this large wedge between market- and survey-based long-term forecasts of inflation.
The recent rise in inflation compensation
To assess the persistence of the recent rise in U.S. inflation, I turn to financial market data, which reflect forward-looking expectations among a large and diverse group of investors and financial market participants. I specifically consider prices of conventional fixed-coupon bonds that pay a nominal interest rate and so-called inflation-indexed bonds that pay a real interest rate because their cash flows adjust to changes in the CPI and therefore maintain their purchasing power.
The difference between nominal and real yields of the same maturity, known as breakeven inflation (BEI), is a market-based measure of inflation compensation widely used to assess financial market participants’ inflation expectations. Figure 1 shows BEI rates at different maturities, meaning annual average rates of inflation compensation between now and maturity, from 1 to 10 years at the end of March 2021 (green line) and May 2022 (blue line). The nearly flat 2021 BEI curve contrasts with the higher downward sloping 2022 BEI curve.
Figure 1
Breakeven inflation (BEI) rates over 1 to 10 years
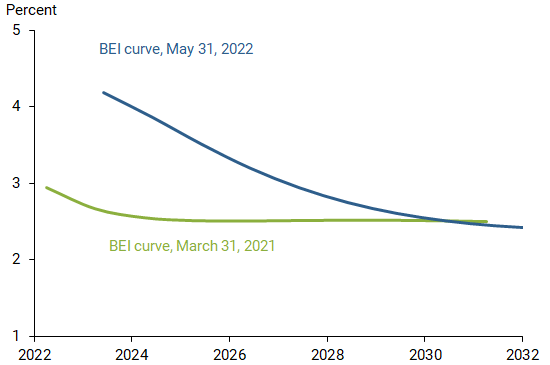
The increase for shorter maturities—the left end of the 2022 BEI curve—is tied closely to the current high level of inflation and suggests that it may remain elevated for some time. In contrast, the similar levels on the right ends of both BEI curves, showing longer maturities, is frequently taken as a sign by many market commentators that investors’ long-term inflation outlook has changed little. However, although long-term BEI rates remain anchored close to 2.5%, it is crucial to account for the change in the shape of the entire BEI curve to understand the sources of variation along any part of the curve, including the long end. To achieve this, I use a yield curve model.
A yield curve model of nominal and real yields
Market-based measures of inflation compensation such as BEI rates reflect three elements. First, they include the average CPI inflation rate expected by bond investors, which is the focus here. Second is an inflation risk premium to compensate investors for the uncertainty of future inflation. This premium is embedded in nominal yields that provide no inflation protection. Third is the difference in market liquidity between standard fixed-coupon and inflation-indexed bonds. The latter tend to have smaller trading volumes, wider bid-ask spreads, and smaller trade sizes (Fleming and Krishnan 2012). Because of their weaker market liquidity, inflation-indexed bond prices carry a liquidity premium that reflects the present value of expected future trading costs plus compensation for the risk of having to sell the bond prematurely at a lower price. This pushes up inflation-indexed bond yields and depresses BEI, which complicates the reading of inflation expectations from BEI (Andreasen and Christensen 2016). Neither the inflation risk premium nor the liquidity premium is directly observable and must therefore be estimated.
To adjust for these challenges, I use the nominal and real yields model developed in Andreasen et al. (2021). It identifies the liquidity premium in inflation-indexed bond prices as a function of the time since issuance and the remaining time to maturity. The time since issuance serves as a proxy for how changes in buy-and-hold investors’ holdings of an inflation-indexed bond affect its liquidity premium. As these holdings tend to be unavailable for trading, they affect the bonds’ liquidity risk. The remaining time to maturity shows how much longer this lockup process will continue and is used to generate the appropriate risk-adjusted discount. These two characteristics are unique for each inflation-indexed bond and are needed to determine the size of its liquidity premium. I further refine the model to account for the asymmetric behavior of nominal yields near the zero lower bound using formulas in Christensen and Rudebusch (2015). I estimate the model using end-of-month data from July 1997 through May 2022. The model-implied BEI breakdown is associated with significant uncertainty because small changes in the estimated dynamic model parameters can lead to sizable changes in the model output. This uncertainty should be considered when interpreting the results.
Results
To assess whether investors’ inflation outlook has fundamentally changed, their longer-term expectations are more relevant than their near-term assessments because the former are presumably less affected by current high inflation and pandemic-related transitory conditions.
For that reason, I focus on the 10-year BEI and present model estimates of its components. Figure 2 shows the observed BEI (dark blue line) and the estimated liquidity-adjusted BEI with no liquidity risk premiums or other residual disturbances (light blue line). The shaded blue area between the two represents the model’s estimate of the liquidity premium for inflation-indexed bonds. The positive liquidity premiums push yields of inflation-indexed bonds higher than their liquidity-adjusted equivalent, which depresses observed BEI. Note that the liquidity premium widened around the financial turmoil in spring 2020 and has remained elevated. In contrast, the estimated liquidity premium of short-term inflation-indexed bonds (not shown) has declined significantly over this period and recently turned negative, signaling that investors are favoring short-term inflation-indexed bonds in the current high-inflation environment.
Figure 2
Components of the 10-year BEI
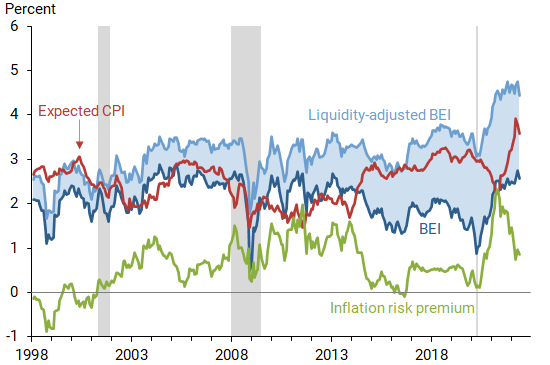
Note: Gray bars indicate NBER recession dates.
Source: Author’s calculations.
The model also breaks down the liquidity-adjusted BEI into an expected CPI inflation component (red line) and the associated inflation risk premium (green line); gray bars indicate recessions as determined by the National Bureau of Economic Research.
While the model-implied inflation risk premium is mostly positive, it fell into negative territory in late 1998 during the deflation scare following the Russian debt crisis and briefly in early 2016 when energy and commodity prices fell sharply. It was already low in 2019 as the global economic outlook weakened in the midst of low inflation. The global spread of the coronavirus kept the inflation risk premium near zero during the first half of 2020. It then rose sharply during the second half of 2020 and into early 2021, only to retrace most of that increase the past 12 months, a normal pattern given the current stage of the business cycle.
More broadly, early on in economic expansions, the inflation risk premium tends to move up while investors’ inflation expectations remain low. As economic recoveries progress, investors gradually raise their inflation expectations and lower the premium they demand for being exposed to inflation risk when it becomes less likely that inflation will overshoot its expected level. Currently, the inflation risk premium is close to its historical average, which suggests that investors view the risks to their outlook as relatively balanced with no particular bias in either direction.
The model-implied 10-year expected inflation is characterized by pronounced business cycle variation. It was close to 2.85% in the years before the Global Financial Crisis. It then fell well below 2% during the crisis and remained there for several years before gradually climbing to close to 3% by fall 2019. Between then and spring 2021 it steadily declined as the global economic outlook weakened and then following the pandemic, before reaching a low of 2.23% in April 2021. Since then, it has bounced back up sharply as inflation readings have surprised to the upside. As of May 2022, the model suggests that 10-year inflation expectations are 3.58%, about half a percent above its maximum value over the past 24 years but down from 3.91% in March.
For perspective, Figure 3 compares the model-implied 10-year expected inflation (red line) to alternative 10-year CPI inflation forecasts from two surveys: the semiannual consensus expectations from the Blue Chip Financial Forecasts survey (gold line) and the quarterly Survey of Professional Forecasters (SPF). The Fed’s 2% inflation target based on the personal consumption expenditures price index, which generally runs a bit lower than CPI inflation, is also shown with a gray horizontal line. For reference, the figure includes realized CPI inflation, showing the average over the next 10 years for each data point, which can be calculated up to May 2012 (blue line).
Figure 3
Comparing 10-year expected CPI and survey forecasts
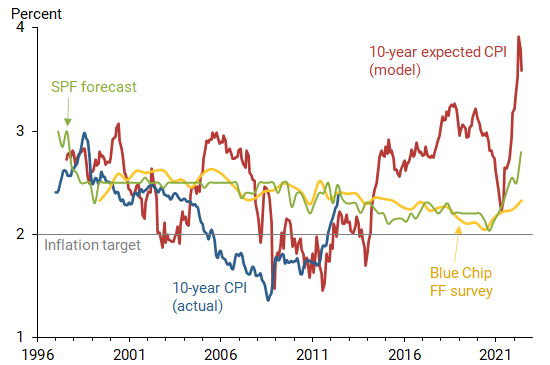
Source: Consumer price index, Survey of Professional Forecasters, Blue Chip Financial Forecasts, and author’s calculations.
Overall, the model estimate is more responsive to economic shocks, both positive and negative, than the survey forecasts are. In particular, the model adjusted more quickly to the low inflation between 2009 and 2014, which is barely noted in the survey forecasts. This also aligns more closely with the available subsequent realized 10-year CPI inflation.
The model estimate’s recent sharp spike above the survey forecasts stands out in this comparison. However, given the large uncertainty surrounding this estimate, it can best be interpreted as early evidence of some risk that investors may have raised their long-term inflation expectations since spring 2021. Hence, the large wedge between the market- and survey-based inflation forecasts warrants careful monitoring.
Conclusion
In light of the current high level of inflation, this Letter examines the related sharp rise in market-based measures of inflation compensation. The goal is to help understand how much this increase reflects changes in investors’ inflation expectations rather than variation in the inflation and liquidity risk premiums investors demand to accept the risky returns for the underlying securities. Using a yield curve model of nominal and real yields allows me to adjust for such premiums. I find early, tentative evidence that investors may have raised their long-term inflation expectations since spring 2021. In contrast, survey-based measures of comparable long-term inflation expectations remain anchored close to 2%, despite some modest upticks. At this point, the wedge between market- and survey-based long-term inflation forecasts merits careful monitoring.
Jens H.E. Christensen is a research advisor in the Economic Research Department of the Federal Reserve Bank of San Francisco.
References
Andreasen, Martin M. and Jens H.E. Christensen. 2016. “TIPS Liquidity and the Outlook for Inflation.” FRBSF Economic Letter 2016-35 (November 21).
Andreasen, Martin M., Jens H.E. Christensen, and Simon Riddell. 2021. “The TIPS Liquidity Premium.” Review of Finance 25(6), pp. 1,639–1,675.
Christensen, Jens H.E. and Glenn D. Rudebusch. 2015. “Estimating Shadow-Rate Term Structure Models with Near-Zero Yields.” Journal of Financial Econometrics 13(2), pp. 226–259.
Fleming, Michael J., and Neel Krishnan. 2012. “The Microstructure of the TIPS Market.” FRB New York Economic Policy Review 18(1), pp. 27–45.
Shapiro, Adam Hale. 2022. “How Much Do Supply and Demand Drive Inflation?” FRBSF Economic Letter 2022-15 (June 21).
Opinions expressed in FRBSF Economic Letter do not necessarily reflect the views of the management of the Federal Reserve Bank of San Francisco or of the Board of Governors of the Federal Reserve System. This publication is edited by Anita Todd and Karen Barnes. Permission to reprint portions of articles or whole articles must be obtained in writing. Please send editorial comments and requests for reprint permission to research.library@sf.frb.org