
Before the pandemic, the U.S. unemployment rate reached a historic low that was close to estimates of its underlying longer-run value and the short-run level associated with an absence of inflationary pressures. After two turbulent years, unemployment has returned to its pre-pandemic low, and the estimated underlying longer-run unemployment rate appears largely unchanged. However, economic disruptions appear to have pushed up the short-run noninflationary rate substantially, as high as 6%. Examining these different measures of the natural rate of unemployment can provide useful insights for policymakers.
The U.S. unemployment rate in March 2022 was 3.6%, near its pre-pandemic 50-year low of 3.5% recorded in February 2020. Despite these similarly low levels, the economic environment now is very different than before the pandemic. The low unemployment at the end of the expansion following the Great Recession coincided with a period of very low inflation: personal consumption expenditures (PCE) price inflation hovered around 1.5% for much of 2019, below the Federal Reserve’s 2% average inflation goal. By contrast, recent low unemployment is associated with much higher inflation: in recent months, PCE inflation has exceeded 5%.
With this contrast in mind, policymakers often rely on two different unemployment benchmarks, or so-called natural rates of unemployment, to assess appropriate monetary policy (Crump, Nekarda, and Petrosky-Nadeau 2020). A first benchmark, the longer-run unemployment rate, provides a guide for normal economic activity in the longer run, after all the shocks that are thought to cause a current business cycle, either an expansion or a contraction, have dissipated. While there is no consensus on the time horizon for this longer run, a general guidepost is 10 or more years in the future. The second benchmark assesses the degree of economic slack and inflationary pressures in the short run and medium run over the next few months through a few years. This “noninflationary rate of unemployment” associated with price stability provides a guide to how likely current labor market conditions are to be connected with inflationary pressures. In sum, these two concepts of the natural rate of unemployment help policymakers address separate concerns when assessing the current state of the economy.
This Economic Letter discusses some common approaches to estimating the unobserved longer-run and noninflationary benchmarks for the natural rate of unemployment following the discussion in Crump et al. (2020). The two benchmarks coincide at times, as they did in late 2019. At other times, there can be a sizable gap, as is the case today, with the noninflationary rate of unemployment well above its longer-run level. This divergence provides useful context for the recent Federal Open Market Committee (FOMC) decision to begin tightening policy to bring inflation back towards its longer-run goal for price stability.
Unemployment rates expected to prevail in the longer run
The structure of the economy and the underlying dynamics of the labor market—factors that change slowly over time—are thought to determine the natural rate of unemployment in the longer run. Researchers use a wide range of approaches to estimate the longer-run natural rate; we focus first on the Congressional Budget Office (CBO) estimate of the “noncyclical rate of unemployment.”
The CBO follows a broad approach that mainly relies on changes in the composition of the labor force. According to Shackleton (2018), the longer-run or noncyclical rate of unemployment is based on an assumption that the U.S. labor market was at its longer-run state during the second half of 2005, and that this was true for different populations grouped according to age, sex, race and ethnicity, and educational attainment. Using the second half of 2005 as a long-run benchmark for each demographic group’s unemployment rate, the CBO constructs an aggregate longer-run rate of unemployment for the United States, adjusting to reflect each group’s actual share of the labor force at different dates over time. As a result, all movements in the CBO’s estimate of the longer-run rate of unemployment come from slow-moving changes in the makeup of the workforce.
Figure 1 shows the noncyclical rate of unemployment (dashed blue line) from 1985 through 2021, along with a range of alternative estimates (shaded area), some of which we describe next. In general, the longer-run estimates change very gradually over time, in contrast to the higher-frequency cyclical fluctuations in the actual unemployment rate (red line).
Figure 1
Estimates of U.S. longer-run rate of unemployment
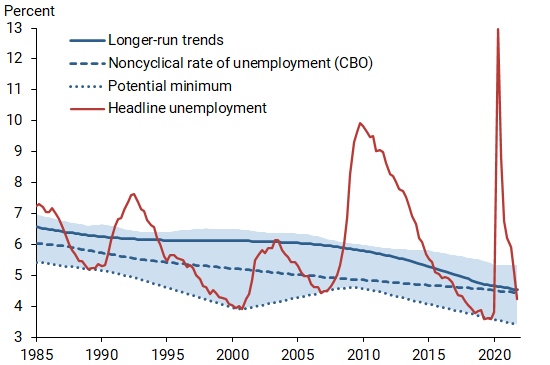
Note: Shaded area represents a range of estimates described in text and in Crump et al. (2020); quarterly data.
Sources: Bureau of Labor Statistics (BLS), CBO, and authors’ calculations using CPS micro data.
A second related approach uses statistical methods to estimate the longer-run trends for different population groups’ unemployment rates from historical experience before aggregating them into an overall longer-run natural rate of unemployment. This approach, which can be categorized as “longer-run trends,” tends to imply higher longer-run rates of unemployment than the CBO estimate. This is especially true around the prolonged period of relatively elevated unemployment in the aftermath of the 2007–08 financial crisis. Our own application of this approach, shown as the blue solid line in Figure 1, draws on monthly microdata from the Current Population Survey and a technique called a bandpass filter to extract the changes in each population group’s unemployment rates over multiple decades. Our approach yields an estimate for the longer-run rate of unemployment of 6.0% in the second half of 2005, compared with the CBO’s 5.0% estimate. By the fourth quarter of 2021, the two approaches result in essentially identical estimates of 4.5%.
A third approach seeks to infer the “potential minimum” rates of unemployment for different demographic groups based on recent business cycle peaks (blue dotted line). Adapting a methodology used by DeLong and Summers (1988) to measure the economy’s level of potential output, this approach results in the lowest contour (dotted red line) in the range of estimates in Figure 1. The approach suggests a longer-run rate of unemployment of 4.3% in the second half of 2005, slightly below the CBO’s estimate during its reference period. For the fourth quarter of 2021, this approach suggests a longer-run rate of unemployment of 3.4%.
Unemployment rates associated with no inflationary pressures
The second benchmark rate is meant to assess the degree of economic slack and inflationary pressures in the short and medium run. It is usually derived from an assumed relationship between price inflation and deviations of actual unemployment from this benchmark, a relation referred to as the Phillips curve.
The most common approach to estimate this benchmark rate of unemployment is to follow a statistical representation known as a state-space model (see Laubach 2001). This method relies on statistical assumptions about the dynamics of an unobserved variable, in this case the noninflationary rate of unemployment. The values of this “state variable” are then determined by the movements of observed unemployment and inflation rates via the Phillips curve, while simultaneously accounting for other factors, such as changes in production costs and currency exchange rates, that affect inflationary pressures in the economy.
Figure 2 plots a range (shaded area) of alternative state-space model estimates of the noninflationary rate of unemployment from 1985 through 2021. The solid blue line highlights our preferred approach to addressing the unique challenges from the COVID-19 pandemic, which we will discuss in greater detail. The figure also includes the CBO’s estimate of the longer-run rate of unemployment (blue dashed line) for reference. The figure highlights the degree to which estimates of the noninflationary rate of unemployment fluctuate with the actual rate of unemployment. It also shows that, over longer periods, the noninflationary rate tends to converge back towards the level of the longer-run rate of unemployment.
Figure 2
Estimates of U.S. stable-price rate of unemployment
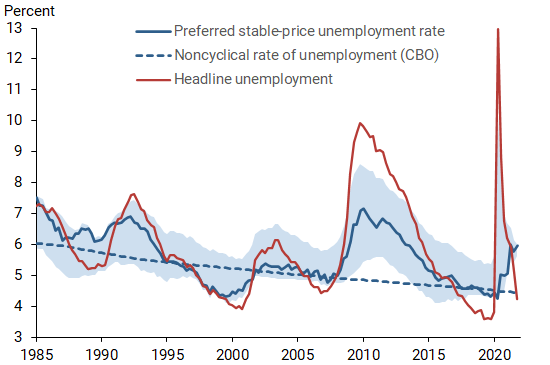
Note: Shaded area represents the full range of estimates from set of sources; quarterly data.
Sources: BLS and authors’ calculations using CPS micro data and estimates reviewed in Crump et al. (2020).
The noninflationary rate of unemployment during the pandemic
Estimating the noninflationary rate of unemployment has been challenging due to the exceptionally large and rapid movements in the unemployment rate during the second quarter of 2020, reaching nearly 15% within two months. In the Phillips curve framework for a given level of the noninflationary rate of unemployment, such a rise in the unemployment rate warrants a more pronounced slowdown in inflation than actually occurred. As a result, models that use the period just before the onset of the pandemic as a baseline imply a sharp increase in the noninflationary rate of unemployment to fit the sharp increase in actual unemployment without a commensurately large decline in price pressures. This is illustrated by the dashed blue line in Figure 3, where the noninflationary rate of unemployment rises sharply to just over 8% in the second quarter of 2020.
Figure 3
Estimates of stable-price unemployment through pandemic
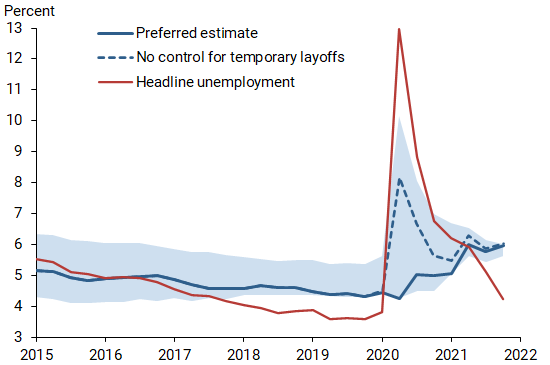
Note: Shaded area represents the full range of estimates from set of sources; quarterly data.
Sources: BLS and authors’ calculations using CPS micro data and estimates reviewed in Crump et al. (2020).
However, much of the rise in unemployment during this period was driven by people on temporary layoff who were expected to return to work. Indeed, the share of unemployed people on temporary layoff rose from 14% before the pandemic to 78% in April 2020 (see Wolcott et al. 2020), only to return to its pre-pandemic level by mid-2021. This contrasts with past recessions, when the share on temporary layoff did not play a large role.
Temporary layoffs do not contribute to inflationary pressures in the same way as permanent job losses: employers tend to maintain ties with these workers so they can quickly bring them back and ramp up production as demand returns. Following this insight, our preferred estimate (solid blue line in Figure 3) controls for the spike in temporary layoffs and results in a limited increase in the noninflationary rate of unemployment at the start of the pandemic. That said, as the share of temporary layoffs reverted to its historical level and PCE price inflation gained momentum in 2021, our estimated noninflationary rate of unemployment progressively rises to 6% in the fourth quarter of 2021, equaling the model that does not control for temporary layoffs (dashed blue line).
Conclusions
Two benchmark natural rates of unemployment can serve as useful guides in assessing the current state of the labor market, particularly relative to the Federal Reserve’s goals of maximum employment and price stability. This Economic Letter outlines various approaches for estimating both the longer-run rate of unemployment and the rate of unemployment associated with price stability. The unprecedented economic conditions during the pandemic created unique challenges for estimating the latter benchmark. Though longer-run and noninflationary rates of unemployment typically do not coincide at a point in time, any gap between the two benchmark rates tends to close over time. As such, the current sizable gap following the disruptions to the economy from the pandemic is likely to close as the FOMC follows an expected path of removing policy accommodation, intended to slow inflation to levels consistent with its price stability goals.
Brandyn Bok is a research associate in the Economic Research Department of the Federal Reserve Bank of San Francisco.
Nicolas Petrosky-Nadeau is a vice president in the Economic Research Department of the Federal Reserve Bank of San Francisco.
References
Crump, Richard K., Christopher J. Nekarda, and Nicolas Petrosky-Nadeau. 2020. “Unemployment Rate Benchmarks.” Federal Reserve Board, Finance and Economics Discussion Series 2020-72.
DeLong, J. Bradford, and Lawrence H. Summers. 1988. “How Does Macroeconomic Policy Affect Output?” Brookings Papers on Economic Activity 1988(2), pp. 433–480.
Laubach, Thomas. 2001. “Measuring the NAIRU: Evidence from Seven Economies.” Review of Economics and Statistics 83(May), pp. 218–231.
Shackleton, Robert. 2018. “Estimating and Projecting Potential Output Using CBO’s Forecasting Growth Model.” Congressional Budget Office, Working Paper Series 2018-03.
Wolcott, Erin, Mitchell G. Ochse, Marianna Kudlyak, and Noah A. Kouchekinia. 2020. “Temporary Layoffs and Unemployment in the Pandemic.” FRBSF Economic Letter 2020-34 (November 16).
Opinions expressed in FRBSF Economic Letter do not necessarily reflect the views of the management of the Federal Reserve Bank of San Francisco or of the Board of Governors of the Federal Reserve System. This publication is edited by Anita Todd and Karen Barnes. Permission to reprint portions of articles or whole articles must be obtained in writing. Please send editorial comments and requests for reprint permission to research.library@sf.frb.org