
How much persistent versus transitory forces contribute to inflation influences the Federal Reserve’s ability to achieve its goal of 2% average inflation over time. If elevated inflation is driven mainly by persistent shocks, then a stronger and longer-lasting policy response is likely to be needed to bring inflation back down. Recent data show that consecutive changes in monthly inflation rates have tended to move increasingly in the same direction. This pattern suggests that the contribution of persistent shocks to inflation has been rising since mid-2019.
U.S. inflation has risen substantially over the past year, driven by supply and demand imbalances related to the COVID-19 pandemic and the associated policy responses (Jordà et al. 2022). The 12-month change in the personal consumption expenditures (PCE) price index rose from 1.4% in January 2021 to 6.6% in March 2022. Events stemming from the conflict in Ukraine may put additional upward pressure on inflation in coming months.
To achieve the Federal Reserve’s goal of 2% average inflation over time, Fed policymakers must assess how much persistent versus transitory shocks are driving movements in inflation. Transitory shocks are more benign because the resulting impacts on inflation tend to dissipate quickly, requiring little or no policy response. In contrast, persistent shocks can push inflation away from the Fed’s goal for sustained periods, requiring a stronger and longer-lasting policy response to bring average inflation back to 2%. From April 2021 through November 2021, five consecutive Federal Open Market Committee (FOMC) statements described inflation developments as “largely reflecting transitory factors” or “factors that are expected to be transitory.” But in testimony before the U.S. Senate Committee on Banking, Housing, and Urban Affairs on November 30, 2021, Fed Chair Jerome Powell stated “We tend to use [the word transitory] to mean that it won’t leave a permanent mark in the form of higher inflation. I think it’s probably a good time to retire that word and try to explain more clearly what we mean…Clearly, the risk of more persistent inflation has risen.”
This Economic Letter examines recent U.S. inflation in the context of historical data extending back to 1960. The correlation between current and past changes in inflation is informative about the likely path of future inflation. More specifically, a stronger correlation between consecutive changes in monthly inflation rates means that inflation changes are more likely to continue moving in the same direction. This pattern, in turn, would suggest that persistent shocks are becoming a more important driving force for inflation. Applying this methodology to U.S. inflation indicates that the contribution of persistent shocks to inflation began increasing before the start of the pandemic, and this trend has continued through the most recent data. The prospect that recent elevated inflation is being driven by persistent shocks raises the risk that inflation will remain above 2% for a longer period. In such an environment, a strong and long-lasting policy response may be needed to achieve the Federal Reserve’s goal of 2% average inflation over time.
Inflation in historical context
Figure 1 plots monthly inflation rates from February 1960 to March 2022, as measured by the 1-month percentage change in the PCE price index (gray bars). The horizontal red line at 0.165% is equivalent to a 12-month compound inflation rate of 2%, corresponding to the FOMC’s longer-run goal announced in January 2012 (Board of Governors 2012). In other words, if monthly inflation readings were 0.165% for 12 consecutive months, then the resulting 12-month change in the PCE price index would equal 2%. In March 2022, the average monthly inflation rate over the trailing 12 months was 0.533% (blue line). This is the highest reading since January 1982 and is more than three times higher than the rate equivalent to the Fed’s goal.
Figure 1
Monthly and 12-month average PCE inflation relative to goal
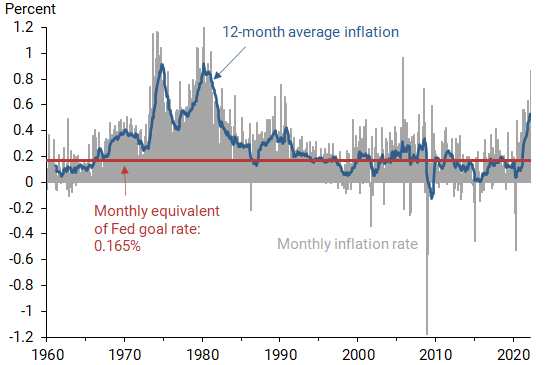
Source: FRB St. Louis FRED database and author’s calculations.
Monthly inflation rates are extremely volatile, exhibiting large upward and downward spikes. While the average monthly inflation rate over the trailing 12 months is much smoother, it can spend considerable time above or below the goal-equivalent rate. From January 2012 through February 2020, just before the start of the pandemic, the average monthly inflation rate over the trailing 12 months was below the goal-equivalent rate for 85% of the time, or 83 out of 98 months. Over the same period, the effective federal funds rate was set near zero for 48% of the time. This prolonged episode of mostly below-goal inflation, despite highly accommodative monetary policy, suggests that persistent downward shocks to inflation were an important driving force for inflation during those years.
Figure 2 provides a closer look at how the PCE price index has evolved since the Fed announced its 2% inflation goal in January 2012. From January 2012 to February 2020, the PCE price index rose at an average annual rate of only 1.39%, again pointing to the idea of persistent downward shocks to inflation. But since February 2020, the index has risen at a much higher average annual rate of 4.20%. This number includes two consecutive monthly declines in the index during March 2020 and April 2020, representing a period of transitory deflation.
In August 2020, the FOMC announced a revised policy framework that “seeks to achieve inflation that averages 2% over time” (Board of Governors 2020), although there is no specific mathematical formula to define the average. Since January 2012, the PCE price index has risen at an average annual rate of 1.96%—very close to the 2% goal. Given the recent elevated inflation readings, an important issue for Fed policymakers is whether recent inflation is being driven mainly by persistent or transitory shocks. If it’s being driven mainly by persistent shocks, there would be an increased risk that future average inflation will be higher than the Fed’s goal.
Figure 2
Evolution of PCE price index trends relative to 2% goal
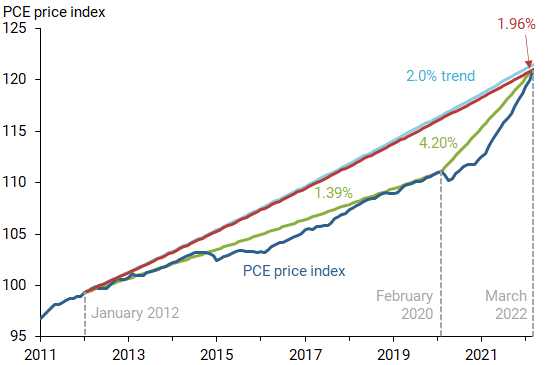
Note: Green line shows the average annual inflation rate computed between the indicated dates, before and after the onset of the COVID-19 pandemic. Red line shows the average annual inflation rate computed since January 2012 relative to a 2% average annual inflation trend over the same period (light blue line).
Source: FRB St. Louis FRED database and author’s calculations.
Persistent versus transitory shocks
Stock and Watson (2007) develop a model of inflation behavior that distinguishes between persistent and transitory shocks to inflation. A transitory shock is one that pushes inflation away from its longer-run value but does not shift the longer-run value. In contrast, a persistent shock is one that can shift the longer-run value over time. In any given sample of data, the relative contribution of persistent versus transitory shocks to inflation can be estimated using a variety of empirical methods. One way to gauge the relative contributions of the two types of shocks is the “shock volatility ratio,” defined as the standard deviation of persistent shocks divided by the standard deviation of transitory shocks.
Jørgensen and Lansing (2022) show that the shock volatility ratio for the Stock-Watson model is directly linked to the correlation coefficient between consecutive changes in inflation, which is a measure of inflation persistence. Another measure of inflation persistence is the correlation coefficient between consecutive levels of inflation. Figure 3 plots both of these persistence measures. In each case, the correlation coefficient is computed using a 10-year rolling window of monthly data. As the window shifts forward in time, older data is dropped while new data is added.
Figure 3
Persistence of PCE inflation levels and inflation changes
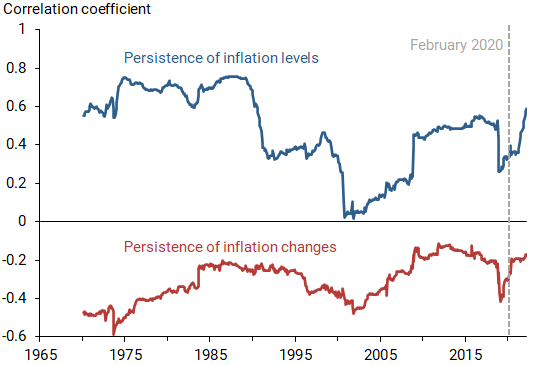
Note: Correlation coefficients computed using a 10-year rolling data window.
Source: Author’s calculations.
The persistence of inflation levels (blue line) was high during the Great Inflation of the 1970s when inflation itself was high. The level of inflation and its persistence both declined when the FOMC pursued an aggressive disinflation policy under Fed Chair Paul Volcker. The persistence of inflation levels started to rebound during the mid-2000s and then rose further during the Great Recession from December 2007 to June 2009. When the 10-year rolling window moves beyond the Great Recession, the persistence of inflation levels drops sharply. The most recent data show a pickup in the persistence of inflation levels that started in mid-2019, nearly a year before the onset of the pandemic.
The persistence of inflation changes (red line) exhibits a pattern that is broadly similar to the persistence of inflation levels. But in the case of inflation changes, higher persistence now corresponds to a less negative correlation coefficient. A strongly negative correlation coefficient indicates that an upward movement in inflation is typically followed by a downward movement, such that inflation tends to remain close to its longer-run value. But as the correlation coefficient for inflation changes approaches zero from below, the behavior of inflation approaches a “random walk,” which follows no regular pattern and therefore has no tendency to revert to any longer-run value. In this extreme case, the level of inflation could drift away from the Fed’s 2% goal for very long periods. It is important to remember, however, that measures of inflation persistence and the level of inflation itself can be influenced by a shift in monetary policy, with the prime example being the Volcker disinflation of the early 1980s (Daly 2022).
Figure 4
Contribution of persistent shocks to PCE inflation has risen
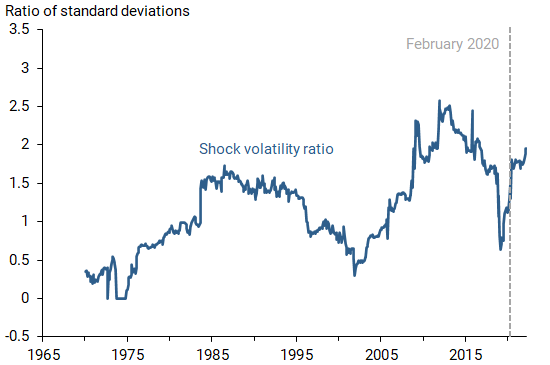
Note: Computed from correlation coefficient between consecutive changes in monthly PCE inflation, as described by Jørgensen and Lansing (2022).
Source: Author’s calculations.
Figure 4 plots the shock volatility ratio computed directly from the correlation coefficient between consecutive changes in monthly inflation. The shock volatility ratio exhibits the same basic pattern as the correlation coefficient plotted in the bottom half of Figure 3. The contribution of persistent shocks to inflation is high during the years following the Great Recession. This pattern helps to account for the persistent undershooting of the Fed’s inflation target from 2012 to 2020. Like the correlation coefficient between consecutive inflation changes, the shock volatility ratio started to rise in mid-2019, and this trend has continued in more recent data.
At the end of the data sample in March 2022, the shock volatility ratio is around 2, which means that persistent shocks to inflation are about twice as volatile as transitory shocks. This result implies that persistent shocks are the more important driver of recent inflation movements. The higher shock volatility ratio in recent data also implies that the optimal forecast should place more weight on recent elevated inflation readings, reflecting an increased likelihood that longer-run inflation has drifted up. But it is important to note that the FOMC’s decision in March 2022 to begin an “appropriate firming in the stance of monetary policy” would be expected to influence the future behavior of inflation.
Conclusion
A simple time series model for U.S. inflation along the lines of Stock and Watson (2007) suggests that persistent shocks to inflation have become more important in recent data. Historical patterns show that persistent shocks can push inflation away from the Fed’s longer-run goal for sustained periods, warranting a stronger and longer-lasting policy response versus the case when elevated inflation is driven mainly by transitory shocks.
References
Board of Governors of the Federal Reserve System. 2012. “Federal Reserve Issues FOMC Statement of Longer-Run Goals and Policy Strategy”(January 25).
Board of Governors of the Federal Reserve System. 2020. “Federal Open Market Committee Announces Approval of Updates to its Statement on Longer-Run Goals and Monetary Policy Strategy”(August 27).
Daly, Mary C. 2022. “This Time Is Different…Because We Are.” FRBSF Economic Letter 2022-05 (February 28).
Jordà, Òscar, Celeste Liu, Fernanda Nechio, and Fabián Rivera-Reyes. 2022. “Why Is U.S. Inflation Higher Than in Other Countries?” FRBSF Economic Letter 2022-07 (March 28).
Jørgensen, Peter Lihn, and Kevin J. Lansing. 2022. “Anchored Inflation Expectations and the Slope of the Phillips Curve.”FRB San Francisco Working Paper 2019-27.
Stock, James H. and Mark W. Watson. 2007. “Why Has Inflation Become Harder to Forecast?” Journal of Money, Credit, and Banking 39, pp. 3–34.
Opinions expressed in FRBSF Economic Letter do not necessarily reflect the views of the management of the Federal Reserve Bank of San Francisco or of the Board of Governors of the Federal Reserve System. This publication is edited by Anita Todd and Karen Barnes. Permission to reprint portions of articles or whole articles must be obtained in writing. Please send editorial comments and requests for reprint permission to research.library@sf.frb.org