
Measuring the price of shelter for homeowners is difficult, even when housing markets are stable. A new measure of shelter price inflation uses mortgage, tax, and insurance payments, rather than the implied rental value of homes used in the consumer price index (CPI). The payments method suggests year-over-year shelter price inflation rose 4.3% nationally in July, compared with the CPI’s 5.8% estimate. Conditions in rental markets likely explain this difference. Comparing the varying results nationally and across regions highlights the challenge of accurately measuring the shelter inflation that homeowners face.
Changes in housing costs for homeowners are accounted for differently in various inflation measures. For example, because the consumer price index (CPI) focuses on consumption, it considers housing as a service that people use, as opposed to an investment good, and only incorporates the price of that service into the index. Accurately measuring the prices of “shelter services” for homeowners is important for a few reasons. Shelter receives the largest weight among components of the CPI, so an accurate measure of shelter prices homeowners face means a more accurate inflation estimate. Moreover, shelter prices may be more directly responsive to monetary policy than prices of other goods and services because mortgage rates can adjust quickly in response to changes in policy interest rates set by the Federal Reserve (Kliesen 2022).
Unfortunately, the price of shelter services for homeowners is hard to measure because the price cannot simply be read off a price tag. The price must be estimated, and there is no single best way—in fact, the method the CPI uses has changed over time. The current measure uses market rents, which assumes renters and owners face similar price dynamics. In addition, rents often change on an annual schedule, which can result in the well-documented lag between the CPI measure and price indexes for houses and rental units (for example, see Lansing et al. 2022).
In this Economic Letter, I create a measure of shelter price inflation for homeowners based on monthly payments for mortgage, tax, and insurance that is meant to complement and address limitations in the CPI measure. My method finds national homeowners’ shelter prices rose 4.3% year-over-year in July 2022, compared with 5.8% in the CPI measure. I explore where and why these differences may occur, with conditions in rental markets playing a key role.
Measuring the price of shelter for homeowners
Estimates of shelter prices for homeowners aim to capture the price of the services provided by an owner’s home. The CPI uses a rental equivalence measure, called owners’ equivalent rent of primary residence. The measure is based on the “implied rent” that owners indirectly pay to live in their homes. Implied rent cannot be observed, so the CPI uses an estimate. This estimate starts with actual rent data for occupied units, then uses econometric models to adjust the rents to account for differing characteristics between renter- and owner-occupied properties, such as the size and number of bedrooms. House prices and an owner’s monthly expenditures, such as mortgage payments and property taxes, are not included because these expenditures are the cost of making an investment rather than the price of consuming a shelter service, and the CPI is intended to measure prices of consumption goods and services, not investments.
For this Letter, I turn to user cost measures as another way to estimate shelter prices for owners. These calculate the costs a homeowner incurs when buying and living in the home and can be justified using the same theory that validates rental equivalence methods (Diewert and Nakamura 2009 and Garner and Verbrugge 2009). I create a proxy for user costs with data on several of a homeowner’s major monthly shelter expenses: mortgage principal and interest payments, property taxes, and insurance payments. I calculate the average monthly payment in each U.S. county or metro area using a large random sample of mortgages from Black Knight McDash, a company that compiles data from residential mortgage servicers.
An advantage of this method is that the payments measure uses actual homeowner costs, rather than estimated implicit rent. This sidesteps issues that could arise in the CPI’s rent-based measure resulting from differing shelter price dynamics for renter- and owner-occupied units and from the lag caused by the tendency for rents to change only annually. While the CPI is available for only 23 metro areas, the payments measure covers nearly all counties and metro areas. This is an advantage because, as a non-traded service, shelter prices show more geographic variation than prices in other CPI categories.
The payments measure faces a few disadvantages. For one, it does not provide information about homeowners without mortgages. Also, because the data don’t include home characteristics, the payments measure cannot be adjusted to create a constant-quality index, which is a key element of the CPI measure. Changes in the payments measure reflect both changes in mortgage terms, such as refinancing, and changes in the sample composition. For example, if homes with newly originated mortgages become larger, are improved over time, and cost more as a result, inflation calculated using an unadjusted measure may be higher than with a constant-quality measure. Finally, to be a perfect proxy for user costs, the payments measure would need additional terms that are hard to quantify, such as depreciation, opportunity costs of investments not made, and expected capital gains on the home. In fact, as addressed in Bolhuis, Cramer, and Summers 2022, the BLS switched away from a cost-based measure in 1983 in order to address some of these measurement issues.
Weighing the advantages and challenges of the payments method suggests it is a useful complement to, rather than replacement for, the CPI and can add to the information available for assessing homeowners’ shelter price inflation.
Homeowners’ shelter price inflation by two measures
Rental equivalence measures, such as what is used in the CPI, are theoretically equivalent to user cost measures. Though the payments measure is an imperfect proxy for user costs, its correlation with the CPI measure should be positive (Garner and Verbrugge 2009), which I confirm with a basic regression model. The gray fitted line based on the data points in Figure 1 shows the two measures do not move one-for-one, partly because the payments measure is only a proxy for user cost. Also, inflation using the payments measure is often lower than inflation in the CPI; this may reflect that mortgage and tax payments tend to be steady over long periods of time for existing mortgage holders, whereas rents used in the CPI measure tend to change relatively more often. Specifically in recent months, though mortgage rates have increased over the year, which would put upward pressure on the payments measure, the sizable stock of mortgages initiated or refinanced before mortgage rates began to rise holds down inflation using the payments measure relative to that using the CPI measure.
Figure 1
Growth in homeowners’ shelter prices since March 2020
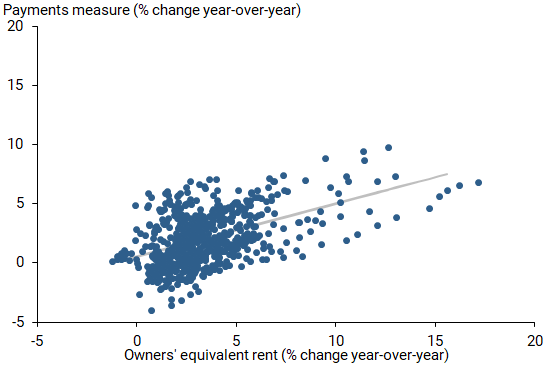
Note: Data are by metro area; linear best-fit (gray line) has a 0.45 slope coefficient and is statistically significant.
Source: Bureau of Labor Statistics, Black Knight McDash Data, and author’s calculations.
By either measure there is substantial geographic variation in shelter price inflation faced by homeowners: for July 2022, the CPI measure ranges from 1.5% to 17.2% across regions, and the payments measure ranges from 1.9% to 9.8%. Wide inflation variation in rental markets may be one explanation for the wider range in the CPI measure. Figure 2 compares the two measures for metro areas with the five highest and five lowest CPI owners’ shelter inflation rates in July 2022. The relative cross-sectional variability of the two measures fluctuates over time but has been rising for both over the past year, indicating greater variation in shelter inflation faced by homeowners across the United States.
Figure 2
Comparing growth in homeowners’ shelter prices: July 2022
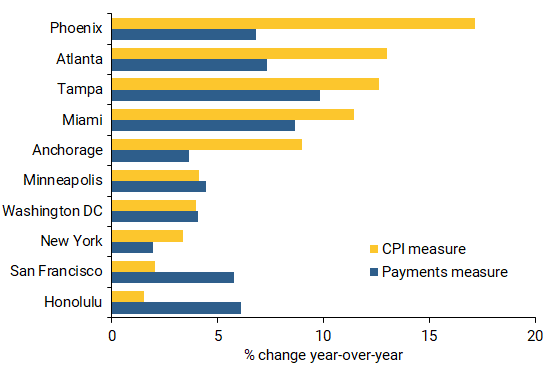
Note: Gold bars show metro areas with five highest and five lowest CPI shelter price growth rates.
Source: Bureau of Labor Statistics, Black Knight McDash Data, and author’s calculations.
The payments measure provides additional insight into this cross-sectional variation. The map in Figure 3 shows wide variation, with inflation generally higher in the west and southeast and lower in the northeast. Since early 2020, the payments measure has found higher shelter inflation for owners on average in rural and suburban areas than in urban areas. The opposite was true in the years before the 2020 pandemic-related recession.
Figure 3
Homeowners’ shelter price inflation using payments measure, July 2022
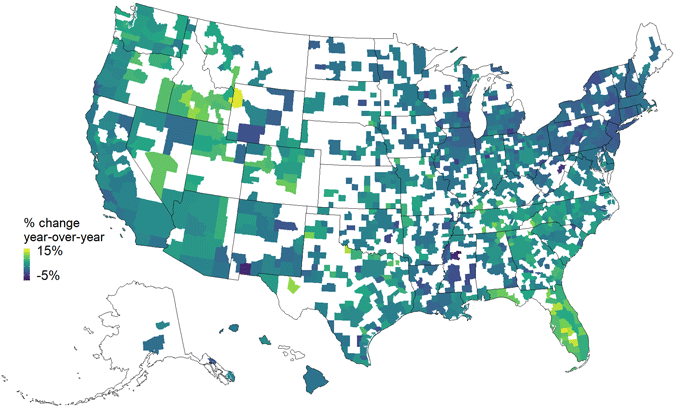
Note: Alaska and Hawaii maps are not to scale. Data listed by metro area; white areas are not in a metro area, have no data, or are too small to report.
Source: Black Knight McDash Data and author’s calculations.
Comparing results from the two methods for a specific area is informative as well. For example, the San Francisco and Honolulu metro areas had the lowest shelter price inflation based on owners’ equivalent rent but were higher based on the payments measure. Other metro areas such as Phoenix, Tampa, and Atlanta had notably higher inflation rates measured by owners’ equivalent rent than measured by monthly payments.
To better understand the differences between the two measures, I assess the relationship between the two using a regression model. The model includes the payments measure and factors affecting housing supply and demand, such as population age shares, population growth, measures of labor market performance, changes in the housing supply, and growth of home values and rents. It also accounts for time trends and regional characteristics that don’t change over time. The results show that the payments measure is a significant predictor of the CPI measure—explaining about 27% of the variation in the CPI measure—but other housing supply and demand factors also matter. Most importantly, adding a measure of growth in rental rates substantially increases the explained variation, to 43%. Including time and region effects also notably increases the explanatory power and, along with other economic and housing market factors, raises the explained variation to 62%, leaving only 38% unexplained.
The results suggest that strength in housing and rental markets translates to higher inflation in the CPI measure; this makes sense because rents are used to create the CPI measure. Some specific areas underscore these regression results: of the metro areas with CPI data, Phoenix, Tampa, and Atlanta had some of the largest home value growth rates according to the most recent data, experienced strong rent growth, and had high CPI inflation. Meanwhile, San Francisco and Honolulu had relatively lower home value growth rates, experienced relatively less rent growth, and had lower CPI inflation.
Conclusion
Shelter price inflation for homeowners can differ substantially depending on how it is measured. This Economic Letter introduces a payments measure based on mortgage, tax, and insurance expenses that owners pay each month. This is in contrast to the CPI measure, which is based on estimates of the rent owners would pay if they were to rent the home they own. The payments measure yields inflation estimates that can differ notably from the CPI measure and are generally lower. Assessing these differences suggests that the specific homeowner costs used in the payments measure tend to rise more slowly than the CPI’s homeowner shelter cost estimates. Since research has shown that individual experiences affect inflation expectations (see, for example, Weber, Gorodnichenko, and Coibion 2022), it may be useful to consider shelter price inflation measures that reflect actual monthly spending by homeowners, such as the payments measure, as complementary information to help shed light on individuals’ inflation expectations.
Leila Bengali is a regional policy economist in the Economic Research Department of the Federal Reserve Bank of San Francisco.
References
Bolhuis, Marijn A., Judd N.L. Cramer, and Lawrence H. Summers. 2022.“Comparing Past and Present Inflation.” Review of Finance 26(5), pp. 1,073–1,100.
Diewert, W. Erwin, and Alice O. Nakamura. 2009. “Accounting for Housing in a CPI.” FRB Philadelphia Working Paper 09-4.
Garner, Thesia I., and Randal Verbrugge. 2009. “Reconciling User Costs and Rental Equivalence: Evidence from the U.S.
Consumer Expenditure Survey.” Journal of Housing Economics 18(3), pp. 172–192.
Kliesen, Kevin L. 2022. “Economic Effects of Fed Tightening Episodes since the 1980s: Part II.” FRB St. Louis, On the Economy Blog (April).
Lansing, Kevin J., Luiz E. Oliveira, and Adam Hale Shapiro. 2022. “Will Rising Rents Push Up Future Inflation?” FRBSF Economic Letter 2022-03 (February 14).
Weber, Michael, Yuriy Gorodnichenko, and Olivier Coibion. 2022. “The Expected, Perceived, and Realized Inflation of
U.S. Households Before and During the COVID-19 Pandemic.” National Bureau of Economic Research Working Paper 29640.
Opinions expressed in FRBSF Economic Letter do not necessarily reflect the views of the management of the Federal Reserve Bank of San Francisco or of the Board of Governors of the Federal Reserve System. This publication is edited by Anita Todd and Karen Barnes. Permission to reprint portions of articles or whole articles must be obtained in writing. Please send editorial comments and requests for reprint permission to research.library@sf.frb.org