

In a tight labor market, workers are able to respond to price increases by bargaining for higher wages. Analyzing conditions since the pandemic shows that, in the recent environment of elevated inflation and low unemployment, wages have become much more sensitive to expected price inflation than in the past. The impact of inflation expectations on wages also appears to have become longer lasting.
The aftershocks of the pandemic and geopolitical events have generated a pickup in inflation across many advanced economies, including the United States. Three factors stand out in understanding this pickup: disruptions to supply chains (Santacreu and LaBelle 2022); pandemic assistance programs (Jordà et al. 2022); and, more recently, the war in Ukraine (Caldara et al. 2022). While supply chain disruptions are gradually being resolved—with the exception of continuing strict lockdowns in China—and pandemic assistance is mostly in the rearview mirror, the war in Ukraine is causing considerable disruptions in energy and food markets with no end in sight. Central banks therefore face the challenge of bringing inflation down at a time when some of its main drivers are outside their control.
Meanwhile, the labor market has largely recovered, with the unemployment rate at historical lows and job vacancy rates at historical highs. With such a tight labor market and elevated inflation environment, workers are likely to demand more pay to retain their purchasing power. In this Economic Letter we investigate the pass-through of inflation into wages by assessing whether wage-setting dynamics have changed since the pandemic. Our estimates point to an increased and longer-lasting sensitivity of wages to inflation expectations since the pandemic.
U.S. price and wage inflation
Inflation in the United States has reached levels not seen in decades, which can have implications for how wages are set. When negotiating contracts, workers may demand higher compensation to make up for their current loss of purchasing power and for expected future losses. In an environment with elevated inflation, even when longer-term inflation expectations remain well anchored and workers expect inflation to eventually be brought down, their shorter-term views may become more relevant for wage demands (Glick, Leduc, and Pepper 2022).
Figure 1 displays headline consumer price index (CPI) inflation (blue line) and household expectations for inflation 1 year ahead (red line) and 5-10 years ahead (green line) from the Surveys of Consumers conducted by the University of Michigan. The figure highlights the dramatic increase in prices over the past year and how expectations for short-term inflation have ticked up in response, despite the relative stability of long-term expectations.
Figure 1
Inflation and short- and long-term inflation expectations
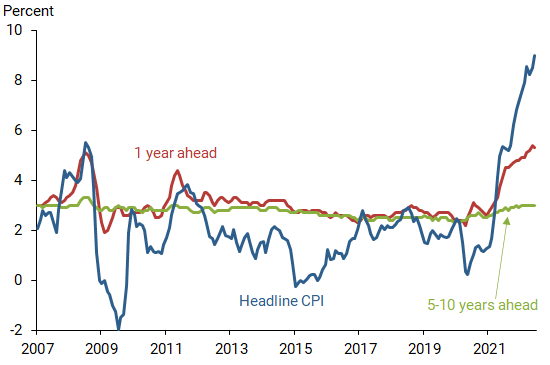
Source: Bureau of Labor Statistics and University of Michigan Surveys of Consumers.
Figure 2 gives a first glimpse of recent dynamics in labor markets over the same period as Figure 1. The picture shows the unemployment rate (blue line) against the three-month moving average of median hourly wage growth in the Current Population Survey from the Atlanta Fed’s Wage Growth Tracker (green line). One clear feature worth discussing is the opposite movement of the lines, which reflects the negative association between the unemployment rate and wages, something we take advantage of in our analysis. Second, the figure highlights the dramatic spike in unemployment at the onset of the pandemic and the swift and unprecedented recovery that followed. Third, and perhaps most important, wage inflation has visibly picked up since the middle of last year, roughly coinciding with the pickup in inflation in Figure 1.
Figure 2
Wages and unemployment
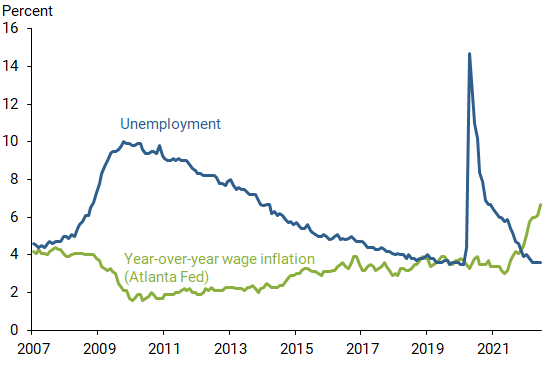
Source: Bureau of Labor Statistics and Atlanta Fed’s Wage Growth Tracker.
The determinants of wage inflation
One relationship that plays a central role in discussions of monetary policy is the Phillips curve. In its current form, the Phillips curve relates the rate of inflation with inflation expectations and the amount of slack in the economy. However, in its original formulation, Phillips (1958) focused on the relationship between wage growth and the unemployment rate. Several new features have been incorporated since then to better understand the economic relationships behind wage-setting dynamics. Galí (2011) considers a wage Phillips curve that features several factors determining how workers bargain for wage contracts. We rely on this specification for our analysis.
Among the determinants we consider in assessing wage setting is the previous rate of wage growth. This acknowledges that, in an environment with stable current inflation and inflation expectations and with the labor market in equilibrium, a previous wage contract would form a natural basis for current negotiations.
Another determinant that we assume workers incorporate into the bargaining process is the behavior of inflation in the recent past. Workers want to maintain their purchasing power. Therefore, they are likely to consider past inflation, which we take to be the average rate of headline inflation over the preceding year. We choose headline inflation because workers will be concerned about the price of all goods and services that they are likely to purchase, including more volatile food and energy prices.
However, when inflation is changing rapidly, workers will also be concerned that they may quickly lose purchasing power during the life of their wage contract. Thus, we assume they are likely to incorporate expectations of future inflation over the short term. Because energy and food prices have remained persistently elevated over the past six months, it again makes sense to consider headline inflation expectations rather than core inflation.
Finally, a worker’s bargaining position is likely to be strongest when the labor market is tight. One common measure of labor market tightness is the difference between the unemployment rate and the natural rate of unemployment. The latter is a measure of the equilibrium rate of unemployment expected to prevail in an economy growing at its potential with stable prices.
Applying the wage Phillips curve to the data
We use our selection of determinants as the basis for our empirical strategy. Our goal is to document how the wage Phillips curve has behaved since the pandemic to better understand its dynamics and the role that wage growth may play in how quickly inflation returns to more normal levels.
A shortcoming of investigating new phenomena in real time is that not enough data are available for robust statistical results. However, because many countries experienced the pandemic and faced similar economic consequences, we can take advantage of international experiences to bolster our empirical analysis.
Therefore, to estimate the relationships between our wage-setting determinants and wage growth, we rely on a sample of 10 advanced economies: Canada, Denmark, Finland, France, Germany, the Netherlands, Norway, Sweden, the United Kingdom, and the United States. Our sample runs from the first quarter of 2007 to the first quarter of 2022. To explore how the wage Phillips curve may have evolved over time, we split this time sample into two periods, before and after the onset of the pandemic, with the former ending in the fourth quarter of 2019.
We should acknowledge that wages, prices, and all the other variables in our analysis are a result of their interactions with each other in the economy, which may call for more elaborate estimation methods. Our goal is more limited, however. We are interested in exploring the relative shifts in the relationships between wage growth and its determinants due to the pandemic and its aftermath. This simplifies our estimation procedure.
We adjust our formulation to allow countries to have different rates of average wage growth to reflect differences in their labor markets. We also account for business cycle effects, the pandemic, and the war in Ukraine to the extent that all countries responded in a similar way to these events. We end up with a combination of factors we described in the previous section, and a group of “other” minor factors.
Figure 3 shows our results for the United States. For each quarter in the sample, the stacked bars show the overall rate of wage growth, composed of the contributions from each of our wage Phillips curve components. We omit data for the first two quarters of 2020, during which strict lockdowns were enforced virtually everywhere. This allows us to distinguish clearly between the periods before and after the onset of the pandemic.
Figure 3
Changing components of wage inflation over time
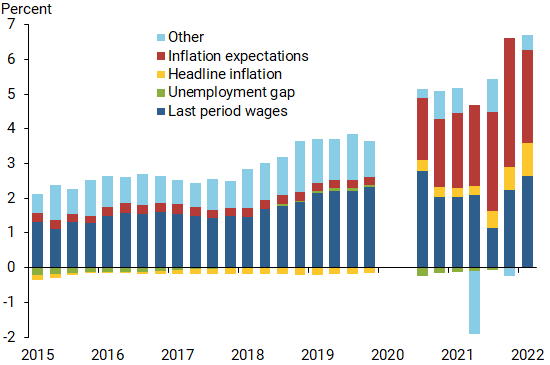
Source: Authors’ calculations.
The figure shows that, while inflation expectations (red bars) mattered before the pandemic, they now play a much more prominent role in explaining current wage growth. We estimate that inflation expectations in the earlier period had about a 12% pass-through to wage inflation on average. Since the pandemic, we estimate the average pass-through to be 100%.
Another way to assess the increased weight that inflation expectations have in wage-setting dynamics is by exploring how persistent its effects are. We do this using the same factors that we relied on in Figure 3, but this time we explore their effects on wage growth several periods in the future. Figure 4 displays the estimated effects of inflation expectations over time before and since the pandemic.
Figure 4
Estimated effects of inflation expectations on wage growth
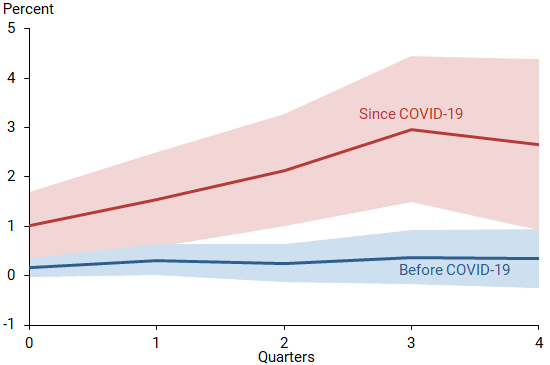
Source: Authors’ calculations.
The nearly flat blue line near zero indicates that, before the pandemic, the estimated effects of inflation expectations played a small role on wage inflation over time. This is consistent with the 12% pass-through we reported earlier for the pre-pandemic sample, which corresponds to the effects of inflation expectations at time 0. The 90% confidence band (blue shading) suggests that these effects barely change over time and are virtually indistinguishable from zero.
In contrast, the red line represents the estimated effects of inflation expectations since the pandemic, which starts at 1, representing the 100% pass-through that we reported earlier. Its influence grows over several quarters before beginning to settle. The 90% confidence band (red shading) also shows that the effects remain statistically significant for some time afterward. The results suggest that inflation expectations are playing a more important role, and this stronger role is felt over several periods.
Conclusion
As the U.S. economy emerges from the pandemic, inflation has been highly elevated and labor markets have been very tight. In this environment, wage growth has also picked up. Our findings show that, since the pandemic, inflation expectations have been playing a more prominent role in wage-setting dynamics than in the past. Moreover, the influence of inflation expectations is being felt over a longer period of time. The longer inflation and inflation expectations remain elevated, the higher and longer-lasting the pressures on wage growth are likely to be.
Òscar Jordà is a senior policy advisor in the Economic Research Department of the Federal Reserve Bank of San Francisco.
Celeste Liu is a research associate in the Economic Research Department of the Federal Reserve Bank of San Francisco.
Fernanda Nechio is a vice president in the Economic Research Department of the Federal Reserve Bank of San Francisco.
Fabián Rivera-Reyes is a research associate in the Economic Research Department of the Federal Reserve Bank of San Francisco.
References
Caldara, Dario, Sarah Conlisk, Matteo Iacoviello, and Maddie Penn. 2022. “The Effect of the War in Ukraine on Global Activity and Inflation.” Federal Reserve Board of Governors FEDS Notes, May 27.
Galí, Jordi. 2011. “The Return of the Wage Philips Curve.” Journal of the European Economic Association 9(3), pp. 436–461.
Glick, Reuven, Sylvain Leduc, and Mollie Pepper. 2022. “Will Workers Demand Cost-of-Living Adjustments?” FRBSF Economic Letter 2022-21 (August 8).
Jordà, Òscar, Celeste Liu, Fernanda Nechio, and Fabian Rivera-Reyes. 2022. “Why Is U.S. Inflation Higher than in Other Countries?” FRBSF Economic Letter 2022-07 (March 28).
Phillips, A.W. 1958. “The Relationship between the Unemployment Rate and the Rate of Change of Money Wage Rates in the United Kingdom: 1861–1957.” Economica 25(100), pp. 283–299.
Santacreu, Ana María, and Jesse LaBelle. 2022. “Supply Chain Disruptions and Inflation during COVID-19.” FRB St. Louis Economic Synopses 2022-11 (May 12).
Opinions expressed in FRBSF Economic Letter do not necessarily reflect the views of the management of the Federal Reserve Bank of San Francisco or of the Board of Governors of the Federal Reserve System. This publication is edited by Anita Todd and Karen Barnes. Permission to reprint portions of articles or whole articles must be obtained in writing. Please send editorial comments and requests for reprint permission to research.library@sf.frb.org