
Tight labor markets have raised concerns about the role of labor costs in persistently high inflation readings. Policymakers are paying particular attention to nonhousing services inflation, which is considered most closely linked to wages. Analysis shows that higher labor costs are passed along to customers in the form of higher nonhousing services prices, however the effect on overall inflation is very small. Labor-cost growth has no meaningful effect on goods or housing services inflation. Overall, labor-cost growth is responsible for only about 0.1 percentage point of recent core PCE inflation.
Inflation has persisted above the Federal Reserve’s goal of 2% since the middle of 2021. In a November 2022 speech, Federal Reserve Chair Jerome Powell mentioned that it is helpful to explain elevated inflation levels by examining three underlying categories: goods, housing services, and nonhousing services. He paid particular attention to the last category, stating that it “may be the most important category for understanding the future evolution of core inflation. Because wages make up the largest cost in delivering these services, the labor market holds the key to understanding inflation in this category” (Powell 2022).
Nonhousing services (NHS) are an important component of overall inflation, making up over half of the core personal consumption expenditures (PCE) price index. Worker wages and benefits make up the bulk of costs to firms in this category, but changes in labor costs do not necessarily influence services prices. Companies can instead absorb such costs into their profit margins or, in some cases, substitute with automation or improved efficiency (Leduc and Liu 2023). Numerous studies have shown that labor costs have little impact on services inflation or inflation overall (see Barlevy and Hu 2023).
In this Economic Letter, I examine the manner and the extent to which labor costs influence price inflation, particularly NHS inflation. I find that increases in labor costs act like supply shocks, whereby businesses pass on higher costs to consumers in the form of higher prices. By contrast, labor cost growth does not appear to fuel inflation through higher demand. As expected, NHS prices respond more than goods or housing services prices to changes in labor costs, however the effect is small and occurs slowly over a long time. A 1 percentage point (pp) increase in labor costs causes only a 0.15pp rise in the contribution of NHS prices to core PCE inflation over a four-year horizon, which is less than 0.04pp per year. This implies that the recent run-up in the employment cost index (ECI) is contributing only about 0.1pp to current core PCE inflation, stemming entirely from the impact on NHS inflation.
Measuring labor costs
From among the multitude of measures of labor costs, I use the total compensation ECI for civilian workers, produced by the Bureau of Labor Statistics (BLS). The ECI has some advantages over other measures such as average hourly wages. First, since it is a fixed-weight index, it accounts for changes in the industrial-occupational composition of the workforce. This means that it adjusts for shifts in labor costs associated with changes in the distribution of workers by occupation and industry. Second, it accounts for total employment costs to businesses, which includes workers’ benefits in addition to their salaries and wages. A disadvantage of the ECI is that it is produced relatively infrequently, on a quarterly basis.
Figure 1 shows the evolution of year-over-year growth in the ECI against year-over-year core PCE inflation over the past 20 years. The PCE price index represents the Federal Open Market Committee’s (FOMC’s) preferred gauge of inflation. I focus on core PCE inflation, which provides a reliable measure of underlying inflation by excluding highly volatile food and energy prices.
Figure 1
Employment cost index growth and core PCE inflation
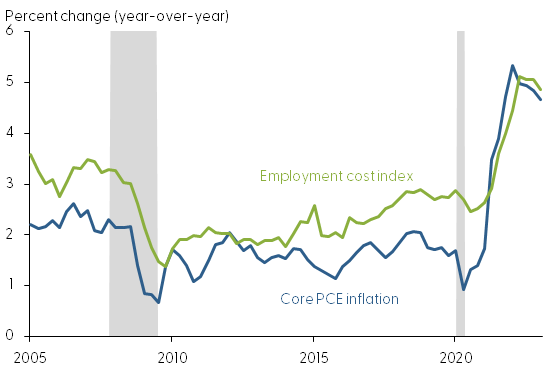
Source: BLS and Bureau of Economic Analysis; gray bars reflect NBER recession dates.
Labor-cost growth and core PCE inflation tend to move together over time, with a correlation of approximately 0.8 over the past two decades. Both series fell precipitously during the Great Recession and then stayed relatively low until the pandemic. Since 2021, both series have risen dramatically. The latest data for the first quarter of 2023 shows the ECI grew 4.9% over the past four quarters, while core PCE prices grew 4.7% over the same time frame.
Components of core PCE inflation
The high correlation of labor-cost growth with inflation implies that the two series are clearly related. To gain a better understanding of how the two are interconnected, it is helpful to break core PCE inflation down by category. The broadest division of inflation is between goods and services. However, as Chair Powell (2022) commented, it is helpful to further divide services into housing and nonhousing components. Housing services include mainly rent payments, which are less directly tied to the labor market. Nonhousing services (NHS), which include categories such as restaurants, hotels, and airlines, are businesses where wages make up a large fraction of total costs. If labor costs are in fact a key driver of inflation, the impact should show up strongest in NHS inflation.
Figure 2 breaks down recent core inflation, measured as the annualized three-month change in the core PCE price index, into these three broad categories: core goods, core housing services, and core nonhousing services. Core goods inflation rose dramatically in 2021 and early 2022 but has since declined considerably. The contribution of core housing services inflation has steadily risen, while the contribution of core NHS inflation has remained elevated throughout the post-pandemic period. Specifically, NHS is contributing 2.4pp the three-month core inflation, which is 1pp larger than its 2016–19 average contribution. It is certainly plausible that the elevated contribution of NHS to core PCE inflation is being driven by the high labor-cost growth shown in Figure 1.
Figure 2
Components of core PCE inflation
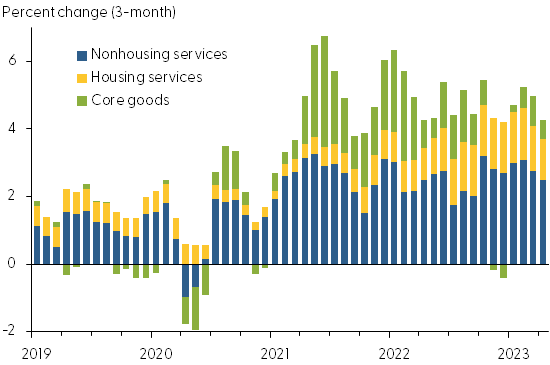
Source: Bureau of Economic Analysis.
How much do labor costs drive inflation?
To measure the extent to which labor-cost growth is driving NHS inflation, I estimate a simple model that isolates surprise changes in the ECI. The model accounts for current and past levels of inflation and economic activity, as well as recent trends in the ECI itself. Removing variation related to observable patterns in the economy isolates the variation in ECI that can be considered the unpredictable or “surprise” component. I use the model to estimate how a surprise change to ECI affects the contribution of goods, housing services, and NHS prices to core inflation at different time horizons. The data cover the period from 1988 to 2023; however, the results do not change when removing the post-2020 period. The results are also similar if I focus on the ECI for workers in private industry or in service-providing industries.
The light blue bars in Figure 3 show the cumulative impact of a 1pp increase in the ECI on the contribution of goods, housing services, and NHS inflation to core PCE inflation over a four-year time horizon. The estimates confirm that labor costs have a stronger impact on NHS inflation than either goods or housing services inflation. The estimates on both goods and housing services inflation are small and statistically indistinguishable from zero, as shown by the dark blue 90th percentile confidence bands around the point estimates. The impact of the ECI on NHS inflation is statistically significant, but the magnitude is quite small. A 1pp increase in the ECI increases the contribution of NHS inflation to core PCE inflation by 0.15pp over four years—an effect of 0.04pp per year. As ECI growth has increased by about 3pp from its pre-pandemic level, this means that labor costs have added approximately 0.1pp to current core PCE inflation.
Figure 3
Cumulative impact of ECI increase on core PCE inflation
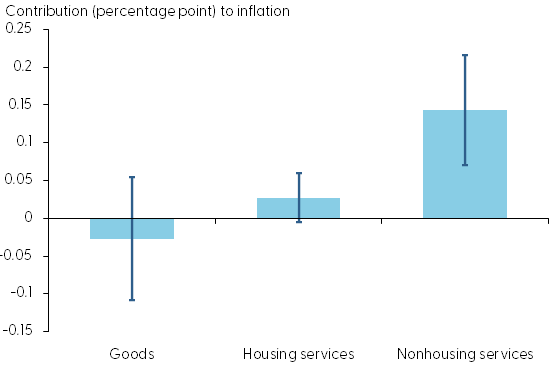
Note: Four-year cumulative impact of 1% increase in employment cost index.
Do labor costs affect inflation through supply or demand?
Wages and labor costs represent not only costs to businesses, they also represent household incomes. Specifically, higher wage growth raises people’s income and thus their willingness to pay for products or services. This increase in consumer demand could ultimately allow businesses to charge higher prices, fueling inflation through the so-called demand channel. This contrasts with the supply channel, which reflects businesses simply passing their higher labor costs along to consumers in the form of higher prices.
To test for demand-related inflation pressures, I use the methodology developed in Shapiro (2022), which breaks PCE inflation into its supply- and demand-driven components. These data series quantify the degree to which either supply or demand is driving inflation in a specific month. The supply-driven contribution includes categories in which quantities move in the opposite direction as prices in a given month. The demand-driven contribution includes those categories in which quantities and prices move in the same direction in a given month. I apply this methodology to the types of services within the broader nonhousing services category, separating the contributions to NHS inflation into those driven by supply and those driven by demand.
I estimate the impact of surprise changes in ECI on these two inflation data series using the same model described earlier. Figure 4 shows the estimates, along with their 90th percentile confidence bands. The ECI has no discernible effect on the demand-driven component of NHS inflation. Instead, the impact of ECI growth on NHS inflation stems entirely from the supply-driven component. Thus, this result indicates that increases in labor costs act like typical supply shocks, whereby businesses pass higher costs along to consumers in the form of higher prices.
Figure 4
Impact of ECI on core PCE: Nonhousing services component
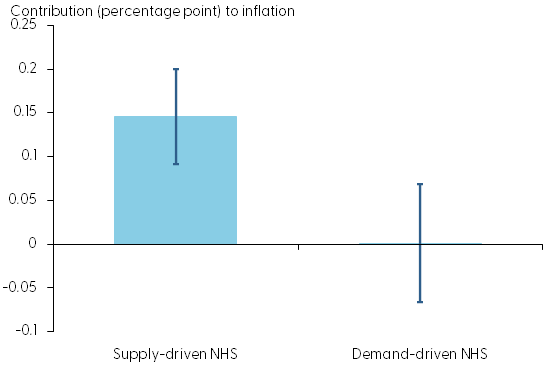
Note: Four-year cumulative impact of 1% increase in employment cost index
Conclusion
Analysis in this Letter shows that labor-cost growth has a small effect on nonhousing services (NHS) inflation, as well as inflation overall. The estimates imply that the recent surge in the employment cost index explains only about 0.1 percentage point (pp) of current elevated inflation readings, a negligible portion of the 3pp increase in the core PCE measure. Further analysis shows that changes in labor costs affect prices mainly through the supply channel. That is, the analysis shows businesses tend to raise prices when wages rise because their costs increase, not because demand increases.
The results cast some doubt on the narrative that labor-cost growth is by itself an important driver of NHS price inflation. This leaves open other explanations for the high correlation between labor-cost growth and inflation. For instance, recent evidence shows that wage growth tends to follow inflation, as well as expectations of future inflation (Glick, Leduc, and Pepper 2022). Overall, the results highlight that recent labor-cost growth is likely to be a poor gauge of risks to the inflation outlook.
Adam Hale Shapiro
Vice President, Economic Research Department, Federal Reserve Bank of San Francisco
References
Barlevy, Gadi, and Luojia Hu. 2023. “Unit Labor Costs and Inflation in the Non-Housing Service Sector.” Chicago Fed Letter 477, March.
Glick, Reuven, Sylvain Leduc, and Mollie Pepper. 2022. “Will Workers Demand Cost-of-Living Adjustments?” FRBSF Economic Letter 2022-21 (August 8).
Leduc, Sylvain, and Zheng Liu. 2023. “Automation, Bargaining Power, and Labor Market Fluctuations.” FRB San Francisco Working Paper 2019-17.
Powell, Jerome H. 2022. “Inflation and the Labor Market.” Speech at the Hutchins Center on Fiscal and Monetary Policy, Brookings Institution, Washington, DC. November 30.
Shapiro, Adam Hale. 2022. “Decomposing Supply and Demand Driven Inflation.” FRB San Francisco Working Paper 2022-18.
Opinions expressed in FRBSF Economic Letter do not necessarily reflect the views of the management of the Federal Reserve Bank of San Francisco or of the Board of Governors of the Federal Reserve System. This publication is edited by Anita Todd and Karen Barnes. Permission to reprint portions of articles or whole articles must be obtained in writing. Please send editorial comments and requests for reprint permission to research.library@sf.frb.org