

U.S. households built up savings at unprecedented rates following the strong fiscal response and lower consumer spending related to the pandemic. Despite recent rapid drawdowns of those funds, estimates suggest a substantial stock of excess savings remains in the aggregate economy. Since 2020, households across all income levels have held a historically large share of savings in cash or other easily accessible forms. Estimates suggest that those funds could be available to support personal spending at least into the fourth quarter of 2023.
Update as of August 16, 2023, in SF Fed Blog
Pandemic-related fiscal support resulted in a sizable increase in disposable income in the overall U.S. economy at a time when health-related economic closures and social distancing led to a significant drop in household spending. As a result, aggregate personal savings rose rapidly, far beyond its pre-pandemic trend and much higher than in previous recessions.
In this Economic Letter, we examine how household saving patterns since the onset of the pandemic recession compare with previous recessions. We show that households rapidly accumulated unprecedented levels of excess savings—defined as the difference between actual savings and the pre-recession trend—relative to previous recessions. Moreover, despite a rapid drawdown of savings in recent months, there is still a large stock of aggregate excess savings in the economy—some $500 billion. The distribution and allocation of excess savings and wealth across the income distribution suggest that households on average, including those at the lower end of the distribution, continue to have considerably more liquid funds at their disposal compared with the pre-pandemic period. We expect that these excess savings could continue to support consumer spending at least into the fourth quarter of 2023. This outlook is uncertain depending on, for example, whether households have developed a preference for higher savings, significantly shifted their spending patterns, or substituted other sources of income for the expired pandemic-era cash inflows.
Fiscal spending and excess savings following recessions
The fiscal response to the onset of the pandemic was swift and significant. Between 2020 and 2021, the federal government launched several stimulus packages that injected about $5 trillion into the U.S. economy at a time when many people had seen their household incomes dwindle (Bureau of Labor Statistics 2023; Congressional Budget Office 2020, 2021).
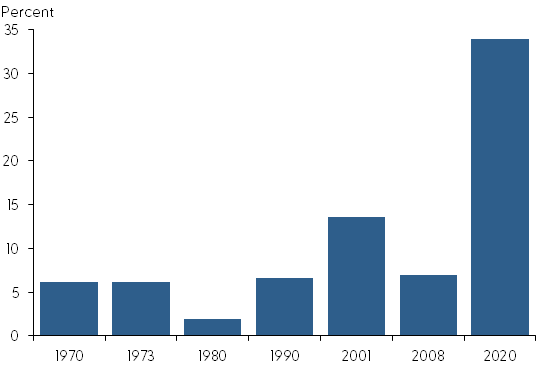
Figure 1 shows the sizable fiscal action in the pandemic relative to other recessions. We measure this as growth in real nondefense discretionary fiscal outlays over a period of two years, starting in the fiscal year in which each recession began according to the National Bureau of Economic Research (NBER), relative to the two years preceding the recession onset. Discretionary spending includes all financial obligations by the federal government that are authorized by congressional budgetary or spending acts, including fiscal stimulus packages that are introduced in response to economic downturns. By contrast, nondiscretionary spending refers to government benefits such as Social Security and Medicare. The growth in fiscal spending during the pandemic period, in nominal and real terms, was far beyond growth associated with other post-1970 recessions.
Figure 1
Fiscal spending growth following onset of recessions
Source: Congressional Budget Office.
Note: Growth in inflation-adjusted nondefense discretionary government spending over the first two years following the onset of a recession as defined by the NBER, relative to the two fiscal years preceding it. For simplicity, the two recessions in the early 1980s are combined.
The pandemic-related financial support to U.S. households included direct assistance such as stimulus checks, expanded unemployment insurance benefits and coverage, and child tax credits. Indirect assistance to households included the Paycheck Protection Program and several rounds of national and local eviction moratoriums, which helped people keep their jobs and housing. Those programs injected funds into households and relieved expenses, resulting in a striking increase in disposable income in the U.S. economy. Simultaneously, health-related social distancing and business closures combined to deliver a steep decline in consumer spending through 2020 and into 2021. As a result, overall personal savings rose rapidly during the pandemic, far beyond what the economy would have accumulated without such shocks, as indicated by the pre-pandemic trend.
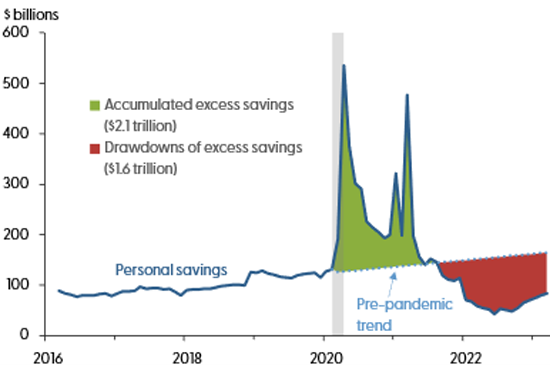
The accumulated difference between actual savings and the pre-pandemic trend can be interpreted as the stock of excess savings in the overall economy. Figure 2 defines the pre-pandemic trend as the forward-looking, out-of-sample projection implied by a linear regression on monthly aggregate personal savings for the 48 months leading to the onset of the pandemic recession. We estimate that accumulated excess savings, in nominal terms, totaled around $2.1 trillion through August 2021, when it peaked (green area).
Figure 2
Aggregate personal savings versus the pre-pandemic trend
Source: Bureau of Economic Analysis and authors’ calculations.
Note: Excess savings calculated as the accumulated difference in actual de-annualized personal savings and the trend implied by data for the 48 months leading up to the first month of the 2020 recession as defined by the NBER.
After August 2021, aggregate personal savings dipped below the pre-pandemic trend, signaling an overall drawdown of pandemic-related excess savings. The drawdown to on household savings was initially slow, averaging $34 billion per month from September to December 2021. It then accelerated, averaging about $100 billion per month throughout 2022, before moderating slightly to $85 billion per month in the first quarter of 2023. Cumulative drawdowns reached $1.6 trillion as of March 2023 (red area), implying there is approximately $500 billion of excess savings remaining in the aggregate economy. Should the recent pace of drawdowns persist—for example, at average rates from the past 3, 6, or 12 months—aggregate excess savings would likely continue to support household spending at least into the fourth quarter of 2023. This outlook can be possibly extended into 2024 and beyond if, for instance, drawdown rates moderate or household preferences for savings increase.
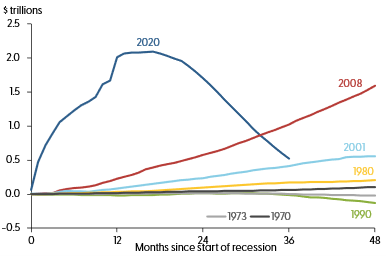
This dynamic in excess savings associated with the pandemic period is remarkably unlike any past recessions. Figure 3 plots the monthly accumulation of excess savings since the onset of past recessions, where each of their respective pre-recession trends are calculated in the same way as described earlier for the pandemic episode.
Figure 3
Aggregate excess savings following onset of recessions
Source: Bureau of Economic Analysis and authors’ calculations.
Note: Excess savings calculated as the accumulated difference between actual personal savings and the trend implied by data for the 48 months leading up to the first month of each recession as defined by the NBER. For simplicity, the two recessions in the early 1980s are combined.
The rapid accumulation and subsequent drawdown of excess savings following the onset of the pandemic recession contrasts sharply with the gradual increase in excess savings observed in past recessions. For many recessions, excess savings appears to plateau after three or four years instead of quickly reverting toward their respective pre-recession trends, as seen in the post-pandemic curve. One exception is the Great Financial Crisis of 2008, which was followed by an extended period of personal savings rising above trend. Voinea and Loungani (2022) attribute this rise to households slowly making up for the wealth and asset values lost during the 2008 crisis. The stark contrast between the pandemic recession and prior recessions holds true when the data are adjusted for inflation, as well as when we look at excess savings as a share of trend savings or as percent changes from pre-recession periods.
Household savings across the income distribution
How widely excess savings are spread across households of different income levels is difficult to pin down, mainly due to whether estimation models rely primarily on pre-pandemic data or pandemic-era assumptions. Barnes et al. (2022) summarize different estimates of savings across the income distribution, which arranges households from lowest to highest incomes and divides them into percentile groups. Overall, estimates suggest the two lowest groups in the income distribution hold between 4% and 29% of the total stock of excess savings, while the highest income group holds between 32% and 67%. Estimates that depend more heavily on pre-pandemic data reflect relatively low historic saving rates for lower-income households, resulting in a smaller estimated share of the total stock of excess savings for these households. Conversely, other studies model how changes in work income, spending, and targeted fiscal support may have affected household saving patterns during the height of the pandemic. In general terms, those models move away from historically low savings at the lower end of the income distribution and, hence, estimate a higher share for low-income households.
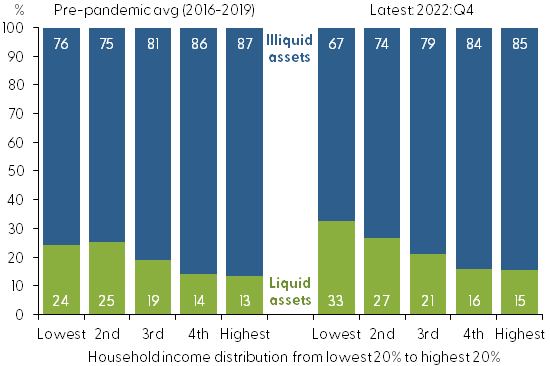
Regarding asset allocation, households have kept more of their financial assets in liquid holdings and investments—defined as currency, checkable deposits, time deposits, short-term investments, and money market fund shares—since the start of the pandemic. This seems particularly true for people at the lower end of the income distribution, as shown in Figure 4. According to Distributional Financial Accounts (DFA) data, which are quarterly estimates of the distribution of U.S. household wealth published by the Federal Reserve Board of Governors, households in the lowest group of the income distribution kept 33% of their financial assets in liquid investments in the fourth quarter of 2022, compared with 24% in the four years leading up to the pandemic (Board of Governors 2023). For the highest income group, liquid assets as a percentage of total financial assets grew from 13% to 15% over the same period, as shown in Figure 4.
Figure 4
Household financial asset allocations by liquidity type
Source: Distributional Financial Accounts and authors’ calculations.
Note: Liquid assets include currency, checkable deposits, time deposits, short-term investments, and money market shares. Illiquid financial assets include long-term and less-accessible investments.
The underlying DFA data suggest that households in the lowest-income group generally experienced steady growth in the dollar value of their total financial holdings from 2016 to 2019, in both inflation-adjusted and nominal terms. Since then, a drop in the dollar value of long-term less-accessible illiquid assets was partially offset by low-income households owning more liquid funds. Conversely, for the highest-income group, although illiquid financial holdings depreciated somewhat in 2022, both asset types generally grew in value before and since the pandemic began.
Data on checking accounts confirm that households have generally held larger cash balances for more than two years following the onset of the pandemic. For example, data by the JPMorgan Chase Institute (Wheat and Deadman 2022) show that median cash balances remained elevated through the middle of 2022 for all income groups relative to pre-pandemic balances. Compared with mid-2019 levels, inflation-adjusted data show that households in the lowest fourth of the income distribution held 41% more in their checking accounts, while those in the highest income group held 29% more.
Overall, a range of data sources and model-based estimates suggests that households across the income distribution continue to hold more liquid funds than in the pre-pandemic period.
Conclusion
U.S. households accumulated excess savings at an unprecedented speed following the onset of the pandemic recession, relative to other post-1970 recessions. Despite recent rapid drawdowns of those savings, a large amount—around $500 billion—remains in the overall economy.
A great deal of uncertainty surrounds precisely how the savings are distributed across household income levels and in what kind of assets they are being kept. Nonetheless, data on household assets and checking account balances support the view that households across the income distribution generally have considerably more liquid funds at their disposal compared with the pre-pandemic period.
Overall, we expect the aggregate stock of excess savings will continue to support consumer spending at least into the fourth quarter of 2023. However, uncertainty also surrounds this outlook, including the possibilities that households may now have a higher appetite for savings, significantly shift their spending habits, or receive other sources of income that offset the expired pandemic-era cash inflows.
Hamza Abdelrahman
Economic Analyst, Economic Research Department, Federal Reserve Bank of San Francisco
Luiz E. Oliveira
Senior Associate Economist, Economic Research Department, Federal Reserve Bank of San Francisco
References
Barnes, Mitchell, Wendy Edelberg, Sara Estep, and Moriah Macklin. 2022. Bolstered Balance Sheets: Assessing Household Finances since 2019. Report (March), The Hamilton Project, Brookings.
Bureau of Labor Statistics. 2022. “Effects of the Coronavirus COVID‐19 Pandemic (CPS).” Labor Force Statistics from the Current Population Survey, November 2.
Congressional Budget Office. 2020. “The Budgetary Effects of Laws Enacted in Response to the 2020 Coronavirus Pandemic, March and April 2020.” June.
Congressional Budget Office. 2021. “The Budgetary Effects of Laws Enacted in Response to the 2020-2021 Coronavirus Pandemic, December 2020 and March 2021.” September.
Voinea, Liviu, and Prakash Loungani. 2022. “Excess Savings Are Recession-Specific and Compensatory: Evidence from the U.S.” Intereconomics 57(4), pp. 233–237.
Wheat, Chris, and Erica Deadman. 2022. “Household Pulse through June 2022: Gains for Most, but Not All.” JPMorgan Chase Institute.
Opinions expressed in FRBSF Economic Letter do not necessarily reflect the views of the management of the Federal Reserve Bank of San Francisco or of the Board of Governors of the Federal Reserve System. This publication is edited by Anita Todd and Karen Barnes. Permission to reprint portions of articles or whole articles must be obtained in writing. Please send editorial comments and requests for reprint permission to research.library@sf.frb.org