

The labor force participation rate for prime-age men has been declining for decades. About 14% of millennial males at age 25 are not in the labor force, compared with 7% of baby boomer males when they were that age. This generational gap declines substantially as groups approach middle age; the decline reflects that younger millennials enrolled in postsecondary education at higher rates and moved into the workforce later than prior generations. The convergence for millennial males suggests that the trend of men’s higher nonparticipation rates may slow in the future.
People in their prime working years, ages 25–54, make up the bulk of the U.S. labor force. However, the fraction of prime-age men not participating in the labor force has risen for decades, from 5.8% in 1976 to 11.4% in 2022. This trend has contributed to slower growth of the U.S. labor force.
In this Economic Letter, we analyze the evolution of the nonparticipation rate for prime-age men, which is relevant for potential economic growth, as high rates of nonparticipation imply fewer workers to create economic outputs. We look at male nonparticipation by age across different generations, which can give insights into future movements in nonparticipation rates.
Our analysis reveals that nonparticipation rates across the age distribution are higher in each subsequent generation. Millennial males ages 25–30 have the highest nonparticipation rates, but by about age 40, rates for this generation are similar to those for 40-year-old men in the prior generation. We attribute this gap at younger ages to millennials’ prolonged investments in formal education relative to earlier generations.
Although ongoing educational investments increase nonparticipation rates, for younger individuals, higher educational attainment eventually creates an offsetting effect. Across the age distribution, we find that the most-educated groups have lower nonparticipation rates and smaller cross-generational gaps than groups with a high school education or less. For these reasons, we argue that the increase in men with postsecondary education puts downward pressure on nonparticipation rates for those graduates later in life. This suggests that, while prime-age nonparticipation rates are likely to continue climbing, the pace of that increase may be slower than in the past.
Trends in prime-age male nonparticipation
Research suggests that no single factor can explain rising nonparticipation among prime-age men (Binder and Bound 2019). Some drivers include changes in industry structure and falling demand for jobs that prime-age men have traditionally held (Valletta and Barlow 2018), and rising health issues, including opioid use (Krueger 2017).
Our Letter complements other research that uses time trends to explain changes in nonparticipation. For this study, we compare the experiences of four generations: the Silent Generation, born 1928–1945, the baby boom generation, born 1946–1964, Generation X, born 1965–1980, and the millennial generation, born 1981–1996.
We use monthly microdata from the Current Population Survey (CPS), the official U.S. household and labor force survey, from 1976 through 2022 to understand the reasons prime-age men are not in the labor force. As of 2022, 39.5% indicate disability or illness, 17.9% are caretakers, 11.0% are in school, and 31.6% are not in the labor force for other reasons such as retirement.
Nonparticipation rates vary systematically by demographic factors such as age and educational attainment. Rates tend to be higher for older individuals and people with a high school diploma or less. Rates for all groups generally increased over the past decades, more so for those with no postsecondary education. The difference in nonparticipation rates between the most- and least-educated groups has widened as a result. Though nonparticipation growth rates and levels are higher for those with less education, the fraction of individuals with a college degree is higher among younger generations. As these younger generations age and make up more of the prime-age population, this may reduce nonparticipation rates.
Explaining changes in prime-age male nonparticipation across generations
To see if the simple passage of time could put downward pressure on nonparticipation through higher participation rates for younger generations, we calculate the rates separately for the four generations in our sample. Figure 1 shows that younger men tend to have somewhat higher nonparticipation rates that decline until about age 30 and increase thereafter. Millennial men follow a similar pattern, except their nonparticipation does not reach a minimum until around age 35.
Figure 1
Nonparticipation rate: prime-age men by generation, age
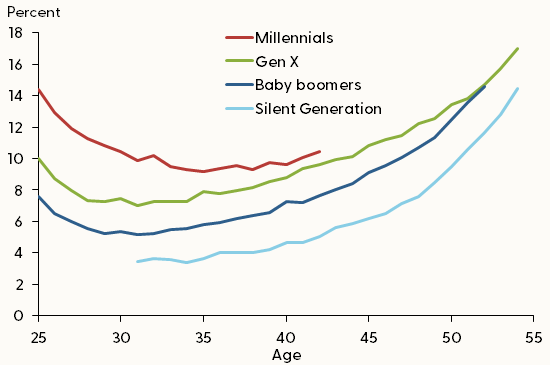
Source: Current Population Survey and authors’ calculations.
The figure also shows that younger generations have systematically higher nonparticipation rates than older ones. This is particularly evident for millennial men through their early 30s. Therefore, the simple passage of time is unlikely to bring down nonparticipation rates. However, the patterns indicate the pace of the increase is slowing. For example, at age 40, the participation rate gap between the Silent Generation and the baby boom generation is 2.6 percentage points. For baby boomers and Generation X, the gap shrinks to 1.6 percentage points, and further still to 1.0 percentage points for Generation X and millennials.
What can explain the level shifts in male nonparticipation rates over generations? One possibility is compositional: nonparticipation rates vary by age, and the overall makeup of the prime-age population shifts over time depending on the size of specific age groups. Therefore, if the composition shifts towards groups with higher nonparticipation rates, that can lower the overall nonparticipation rate. Data show that population shifts have been towards groups that tend to have higher nonparticipation rates, such as older men ages 50-54, and more recently, younger men ages 25-30. However, analyzing the shift in shares (not displayed) shows that the change in age composition within the broad prime-age group explains a relatively small fraction of year-to-year changes in the nonparticipation rate. Further, we use statistical regressions to account for demographic and economic factors that may vary across generations and can affect nonparticipation rates, including race/ethnicity, marital status, state of residence, and the national unemployment rate to capture business cycle sensitivity; however, this has a minimal impact on the patterns in Figure 1.
To further understand why younger generations have higher rates of male labor force nonparticipation, we break down the differences in millennial and baby boomer nonparticipation rates into a set of reasons identified in the CPS data. Based on this information, the main reasons for higher nonparticipation rates among millennials compared with the older generations are a higher incidence of self-reported disability or illness, school enrollment, and caretaker responsibilities. For consistency across generations in the data, we group disability with illness, retirement, and the catch-all “other” as reasons for nonparticipation.
The difference between nonparticipation rates for millennials and baby boomers is largest for younger men and decreases with age (Figure 2). The “other” category, which is mostly driven by disability, contributes the most to higher nonparticipation rates among millennials across all ages. Similarly, Krueger (2017) shows that health conditions, disability, and the rise of opioid prescriptions contribute to rising nonparticipation of prime-age men. Individuals not working due to having a disability are less likely to re-join the labor force, therefore permanently increasing nonparticipation for men in this group (Burkhauser, Daly, and Ziebarth 2016). Caretaking contributes about 1.5 percentage points on average to higher nonparticipation rates in the millennial generation, becoming relatively more important by age 30. Shifts in childcare responsibilities (Council of Economic Advisers 2016) and an aging population increase the number of prime-age men caring for relatives, putting upward pressure on nonparticipation rates relative to earlier generations.
Figure 2
Nonparticipation rate gap for prime-age men by reason
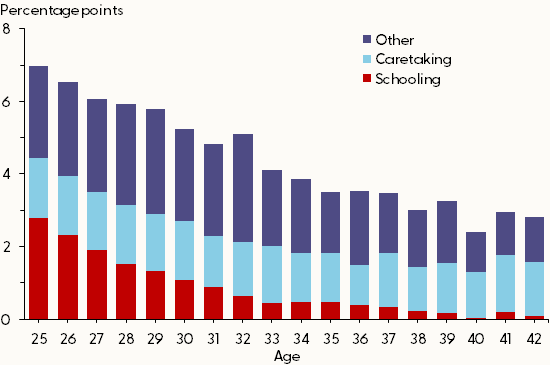
Source: Current Population Survey and authors’ calculations.
While caretaking and all categories grouped as “other” are relatively constant across all age groups, being in school explains more of the baby boomer–millennial labor force nonparticipation gap at younger ages—accounting for about a third of the gap—than at older ages, making up virtually none of the gap by age 42. The 2.7 percentage point reduction in the blue bars in Figure 2—representing the generational nonparticipation rate gap explained by differences in school attendance—explains about two-thirds of the total reduction in the generational gap between ages 25 and 42. This pattern can help explain why the nonparticipation rate for 25–35-year-old millennials in Figure 1 has a higher starting point and steeper initial decline than in previous generations, while disability and caretaking help explain persistent level differences between generations across ages.
The role of education
To further explore the role of education in determining nonparticipation rates, we focus on two groups: individuals who have at most a high school diploma and individuals who have at least a four-year college degree. We continue to find that nonparticipation rates, for both educational attainment groups, are systematically higher across the age distribution for more recent generations. However, Figure 3 shows some notable differences between the groups. For example, the downward trend in nonparticipation rates at young ages is only seen for those with at least a bachelor’s degree (panel B), likely reflecting that the pursuit of additional education delayed people’s labor market entry. In addition, generational gaps in nonparticipation rates are narrower for the college-educated group and are relatively constant across the age distribution. Moreover, since nonparticipation rates are lower for those with a college degree or more, the increasing share of the population completing college may portend downward pressure on nonparticipation rates, similar to findings in Hornstein et al. (2023).
Figure 3
Nonparticipation rates for prime-age men, by generation, age, educational attainment
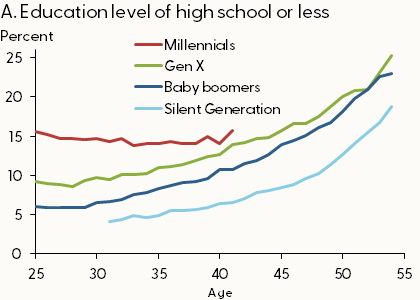
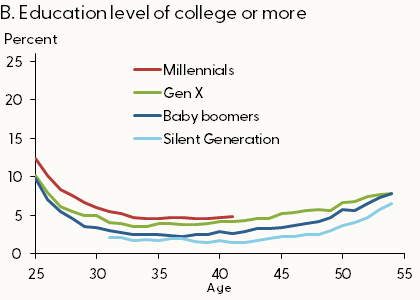
Source: Current Population Survey and authors’ calculations.
For individuals with a high school degree or less (panel A), nonparticipation rates show a notable convergence between millennials and earlier generations. The gap in nonparticipation rates between millennials and baby boomers at age 25 is 9.5 percentage points, but by age 40, it shrinks significantly to only 3.4 percentage points. This suggests that the catch-up in participation for the high school or less group of millennials can help explain the convergence between millennials and earlier generations in Figure 1. Though nonparticipation rates for younger generations are persistently higher for both education groups, if current trends for millennials continue, nonparticipation rates could rise at a slower pace in the future.
Conclusion
This Economic Letter documents how nonparticipation rates have increased with each generation of prime-age men and breaks these differences down according to the reason for nonparticipation. Millennials experience a notably different nonparticipation rate trajectory over their lifetime compared with previous generations, with rates starting at a higher level and declining more steeply until their mid-30s. This temporarily higher level of nonparticipation is driven by school enrollment. Other reasons, such as disability and caretaking contribute to the persistent participation gap between baby boomers and millennials. Even though nonparticipation rates for millennials are still higher than in previous generations, given the increasing educational attainment for younger generations and the trends we observe by education groups, the pace of the sustained rise in male nonparticipation rates may slow in the future, which could benefit economic growth.
Leila Bengali
Regional Policy Economist, Economic Research Department, Federal Reserve Bank of San Francisco
Evgeniya A. Duzhak
Regional Policy Economist, Economic Research Department, Federal Reserve Bank of San Francisco
Cindy Zhao
Research Associate, Economic Research Department, Federal Reserve Bank of San Francisco
References
Binder, Ariel J., and John Bound. 2019. “The Declining Labor Market Prospects of Less-Educated Men.” Journal of Economic Perspectives 33(2), pp. 163–190.
Burkhauser, Richard V., Mary C. Daly, and Nicolas R. Ziebarth. 2016. “Protecting Working-Age People with Disabilities: Experiences of Four Industrialized Nations.” Journal for Labour Market Research 49, pp. 367–386.
Council of Economic Advisers. 2016. The Long-Term Decline in Prime-Age Male Labor Force Participation.
Hornstein, Andreas, Marianna Kudlyak, Brigid Meisenbacher, and David A. Ramachandran. 2023. “How Far Is Labor Force Participation from Its Trend?” FRBSF Economic Letter 2023-20 (August 14).
Krueger, Alan B. 2017. “Where Have All of the Workers Gone? An Inquiry into the Decline of the Labor Force Participation Rate.” Brookings Papers on Economic Activity, Fall, pp. 1–59.
Valletta, Robert G., and Nathaniel Barlow. 2018. “The Prime-Age Workforce and Labor Market Polarization.” FRBSF Economic Letter 2018-21 (September 10).
Graduate Student, Princeton University
Opinions expressed in FRBSF Economic Letter do not necessarily reflect the views of the management of the Federal Reserve Bank of San Francisco or of the Board of Governors of the Federal Reserve System. This publication is edited by Anita Todd and Karen Barnes. Permission to reprint portions of articles or whole articles must be obtained in writing. Please send editorial comments and requests for reprint permission to research.library@sf.frb.org