That’s a lot of questions on a complex subject; timely, too! Here goes…
The Dow Jones Industrial Average Has a History
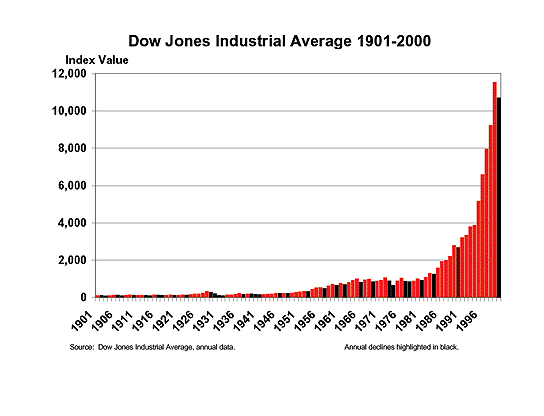
The Dow Jones Industrial Average (DJIA, or Dow) provides a much longer historical comparison than some newer stock market indexes. The Dow, published by Dow Jones, Inc., soared in the 1990s along with most other stock market measures. Still, using annual data going back to 1901, the expansion of the Dow in the 1990s was extraordinary, as Chart A shows.
CHART A — The Dow

There are a number of different firm-level stock indicators; two that are frequently followed are the earnings per share and the price-earnings ratio.1 In addition, there are many stock market indexes that one can use to monitor or evaluate the performance of the overall market or a sector of the market. While all the market indexes are influenced by present and expected macroeconomic conditions, including interest rates, corporate earnings, business cycles, and inflation, the different indexes may exhibit strikingly different performance characteristics.2
A narrowly focused index, the Dow tracks the economic health and earnings outlook for the stocks of 30 blue chip industrial companies (there are separate indexes for transportation firms and utilities). In contrast, the Standard and Poor’s 500 Common Stock index (S&P 500) is a broader measure, a weighted index of the stock prices of 500 large U.S. firms, and its performance reflects conditions across a broad mix of industries.3 The NASDAQ composite index is dominated by high-tech firms, and its performance reflects economic conditions and the outlook for the high-tech sector.4
The Market as a Leading Economic Indicator
The S&P 500 is classified as a leading economic indicator by The Conference Board and is used in their calculation of the composite leading economic indicator series.5 This designation recognizes that the S&P 500, typically rises (falls) several months before the overall economy begins to expand (contract). This is a tendency, not a rule; the economy continued to expand following the 1987 stock market crash.
Biggest Bull Markets
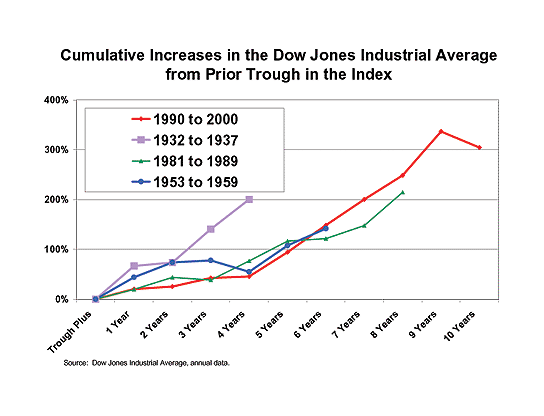
The 1990s’ bull market compares favorably when examined one-on-one against other strong expansions in the Dow. Chart B plots the cumulative percentage increase in the Dow from its previous trough for four noteworthy expansions. This comparison shows that the 1990s’ expansion (even including the decline in 2000) recorded a larger increase and rose for a longer period than occurred during the other three major expansions.
CHART B – Bull Markets

Worst Bear Markets
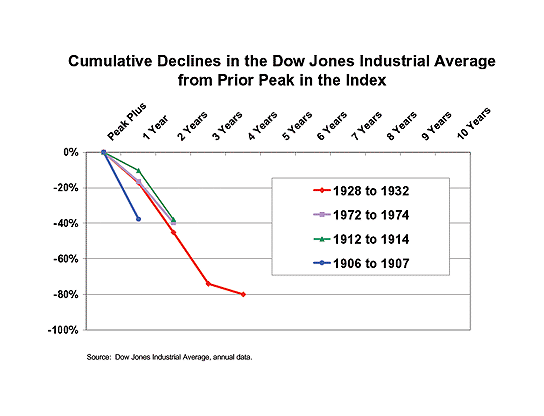
What goes up, sometimes comes back down, which brings us to the subject of bear markets. A bear market is usually defined as a decline of 15 to 20 percent or more over a period of several months or longer. Chart C provides a comparison of several periods with large stock market declines; it plots the cumulative percentage decline in the Dow from its previous peak, showing that the downturn from 1928 to a trough in 1932 was by far the most severe. The Dow fell about 80 percent over this period, which coincides roughly with a sharp decline in gross domestic product that occurred in the early years of the Great Depression. Moreover the Dow fell for four consecutive years, more than twice the length of the next longest declines (1972 to 1974 and 1912 to 1914).
CHART C – Bear Markets

Like Stocks, Indexes also Differ
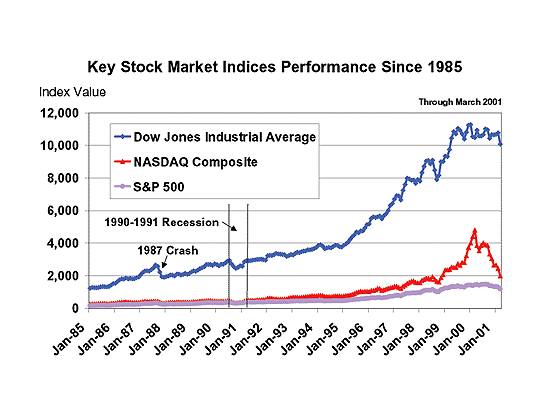
Chart D plots monthly levels of the Dow, the S&P 500, and the NASDAQ, showing their varied performance over the 12 months ending in March 2001. This variation in performance mainly reflects differences in the stocks included in each index. From its monthly peak in January 2000 to March 2001, the Dow (which tracks 30 blue chip industrial companies) fell by more than 10 percent.6 The broader S&P 500 fell by more than 20 percent from its August 2000 peak until March 2001. (This index is more likely to closely reflect overall stock market performance because it monitors the performance of a large group of firms from many industries.)7
While both the Dow and the S&P 500 include some high-tech stocks, the NASDAQ is dominated by these stocks and, therefore, more closely reflects conditions in the high-tech sector. During the rapid expansion of technology firms late in the 1990s, the NASDAQ soared. However, by late 2000, the dot-com expansion came to a jarring halt and the high-tech manufacturing sector began to experience a slowdown in sales, revenues, and profits. As a consequence, the tech-heavy NASDAQ fell much more sharply than the other two indexes, declining by nearly 59 percent from March 2000 to March 2001.
CHART D — Performance Varies

What Causes Bull and Bear Markets?
If I only knew! Let’s take a quick look at the NASDAQ. A thought-provoking article by Simon Kwan (2000) examined the tremendous run-up of tech stocks’ market value from 1995 to the spring of 2000. He compared high-tech stocks’ share of overall market valuation to the sectors’ share of other key economic measures: assets, employment, and sales. Kwan found that after the run-up, “Technology companies dominate in terms of market capitalization, but not in terms of tangible assets, employment, and sales.” /econrsrch/wklyltr/2000/el2000-15.html
Finally, a parting thought on the prospect of bull markets going bust.8 Samuelson and Nordhaus (1998) quote Burton Malkiel’s work on the subject of market “bubbles, panics, and the madness of crowds,” to provide their readers with perspective on stock market bubbles and crashes. Malkiel (1994) noted, “Greed run amok has been an essential feature of every spectacular boom in history.”
Endnotes
1. Earnings per share (EPS) is the earnings per share of common stock, a measure that can be compared across companies and over time. EPS is calculated by taking net income after taxes, less preferred stock dividends, divided by the number of shares of common stock outstanding. The price-earnings ratio (PE ratio) measures the multiple that a stock trades over its EPS. The PE ratio incorporates investors’ expectations about the future earnings and prospects of a firm. See Fabozzi, Modigliani, and Ferri (1994).
2. In addition to differences that arise from including different stocks in different indexes, Fabozzi, Modigliani, and Ferri point out that the indexes may be calculated using different weighting schemes and averaging methods.
3. See Samuelson and Nordhaus, 1998, page 485.
4. The Wilshire 5000 and the Russell 2000 indexes are closely followed by institutional investors. Both are reported in the financial press.
5. The S&P 500 Common Stock index is one of the 10 leading economic indicators that are combined by The Conference Board to generate the composite leading economic indicator series. Leading economic indicators normally turn up (down) before the overall economy begins to expand (contract).
6. Monthly average based on daily closing prices.
7. The Wilshire 5000 index fell about 23 percent during the same period.
8. The collapse of the Japanese stock market after its 1989 peak is another recent example. The Nikkei 225 Average index fell by more than 63 percent from December 1989 to August 1992. Moreover, as of March 2001 the Nikkei was even lower than its August 1992 level.
References
Fabozzi, Frank J., Franco Modigliani, and Michael G. Ferri. (1994) Foundations of Financial Markets and Institutions. Prentice Hall Inc., Englewood Cliffs, New Jersey, Chapter 18.
Kwan, Simon. “Three Questions about ‘New Economy’ Stocks.” FRBSF Economic Letter, Federal Reserve Bank of San Francisco, 2000-15; May 12, 2000. /econrsrch/wklyltr/2000/el2000-15.html
Malkiel, Burton. (1994) A Random Walk Down Wall Street. Norton, New York, 6th edition.
Samuelson, Paul A., and William D. Nordhaus. (1998) Economics. Boston, Irwin/McGraw-Hill Inc., pages 482-489.
The Conference Board. (May 3, 2001) http://www.globalindicators.org/methodology/6month_example.cfm
Addendum
Kwan, Simon. “The Stock Market: What a Difference a Year Makes.” FRBSF Economic Letter, Federal Reserve Bank of San Francisco, 2000-17; June 1, 2001. /publications/economics/letter/2001/el2001-17.html