The Federal Open Market Committee (FOMC), the Fed’s monetary policy-making body, seeks to "promote effectively the goals of maximum employment, stable prices, and moderate long-term interest rates" when conducting policy. (See Purposes and Functions for more information.) While these goals remain the same, the method by which the FOMC has pursued them has evolved-perhaps most notably in the late 1970s and early 1980s.
As stated in Purposes and Functions, the Fed can achieve its monetary policy goals in one of two ways:
- targeting the quantity of money (commonly measured by the monetary aggregates: M1, M2 and M3)
- targeting the price of money (commonly known as the
"federal funds rate"1)
Monetary Policy Implementation Before 1979
Before October 1979, the Fed generally targeted the price of bank reserves in the financial system. The tightness or ease of policy was gauged by changes in the federal funds rate. More specifically, the FOMC set a federal funds rate level called the "fed funds target rate" which was believed to be consistent with the desired values of the goal variables. Then, the Trading Desk at the Federal Reserve Bank of New York bought and sold securities (through open market operations) to reach the desired fed funds target rate. Interestingly, in the 1970s changes in the fed funds rate were not announced publicly after each FOMC meeting as they are now in the meeting statement. Instead, decisions by the FOMC to change the federal funds rate and by how much had to be inferred from the Fed’s purchases and sales of government securities through open market operations.
A New Fed Policy: Targeting Monetary Aggregates (October 1979 – October 1982)
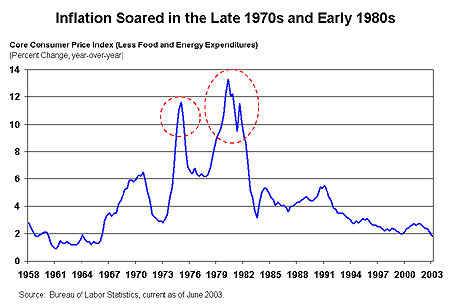
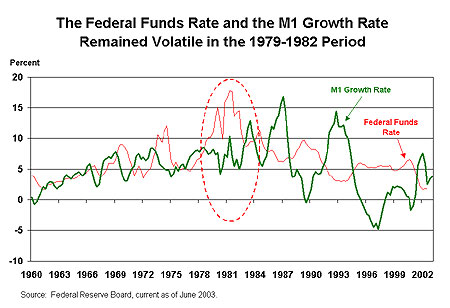
In October 1979, under Chairman Paul Volcker, the FOMC changed its approach to monetary policy and began to target the quantity of money—specifically nonborrowed reserves.2 It was believed that targeting the level of nonborrowed reserves was a better approach to controlling inflation which, as shown in Chart 1, had risen to very high levels in the mid- and late-1970s. FOMC members expected that the new approach to monetary policy would result in greater volatility in the fed funds rate. This was indeed the result. As shown in Chart 2, the average fed funds rate fluctuated greatly between 1979 and 1982.
Chart 1
The late 1970s also marked the beginning of a period of significant interest rate deregulation and financial market innovation that influenced the Federal Reserve’s ability to make monetary policy by targeting the monetary aggregates. A particularly significant development was the growing popularity of money market mutual funds as an alternative savings vehicle and the gradual elimination of interest rate ceilings on all deposit accounts except for demand deposits. As households shifted balances between traditional deposit accounts and the deregulated accounts and money market mutual funds, it had a profound impact on the level and growth rates of the various monetary aggregates, depending on which accounts were included in each aggregate.3
As seen in Chart 2, beginning in the early 1980s, M1 began to exhibit wide fluctuations in growth that do not appear to have been related economic conditions.
Chart 2
Moving Away from Targeting M1 (Starting in Late 1982)
In response to financial market innovation and decreased inflation, the Federal Reserve shifted back to its approach of targeting the price rather than the quantity of money in the fall of 1982. In other words, the FOMC, through the Trading Desk at the Federal Reserve Bank of New York, began to conduct open market operations that targeted a particular degree of tightness or ease in reserve market conditions. For a time, the Fed also focused on the broader monetary aggregate known as M2. But in July 1993, Chairman Alan Greenspan testified to Congress that the Fed would no longer use monetary aggregates to guide FOMC policy:4
At one time, M2 was useful both to guide Federal Reserve policy and to communicate the thrust of monetary policy to others…The so-called "P-star" model, developed in the late 1980s, embodied a long-run relationship between M2 and prices that could anchor policy over extended periods of time. But that long-run relationship also seems to have broken down with the persistent rise in M2 velocity…
In summary, the Fed has pursued several approaches to monetary policy, depending on the economic and regulatory environment at the time. Fed policymakers have successfully tailored monetary policy strategy to address varied economic conditions, financial deregulation, and financial and technological innovation.
For a brief overview of the current policy for implementing monetary policy, please see the Federal Reserve Bank of San Francisco’s publication, U.S. Monetary Policy: An Introduction, /publications/federalreserve/monetary/index.html.
Endnotes
1. The federal funds rate is the interest rate or "price" that banks charge each other for overnight borrowing. Changes in the federal funds rate, the interest rate or "price" of overnight loans between commercial banks, may fluctuate day by day and between different banks. But, the general level of the federal funds rate affects the prime rate and other interest rates offered to bank customers, and in turn either encourages or discourages new borrowing, investment, and economic growth.
2. Nonborrowed reserves are the portion of total reserves in the banking system that have not been borrowed by depository institutions from the Federal Reserve Bank.
3. For example, the removal of interest rate ceilings permitted interest to be paid on most consumer transaction accounts, including negotiable orders of withdrawal (NOW) accounts, which are interest-earning accounts on which checks may be drawn. NOW accounts are included in M1 and other monetary aggregates. In 1982, the Garn-St Germain Act introduced money market deposit accounts (MMDAs), which were also free of interest rate ceilings, however the savings features of these accounts and money market mutual funds meant that they were included in the M2 monetary aggregate, but not in M1. As consumer savings shifted among MMDAs, money market mutual funds, and NOW accounts depending on their attractiveness (relative interest rate yields) growth of the M1 and M2 monetary aggregates became more volatile.
4. "Statement to Congress." Federal Reserve Bulletin. September 1993. Pages 849-855.
Further Resources
Meulendyke, Ann-Marie. "The Federal Reserve and U.S. Monetary Policy: A Short History." U.S. Monetary Policy and Financial Markets. Federal Reserve Bank of New York. 1998. Available at: http://www.newyorkfed.org/pihome/addpub/monpol/.
Mishkin, Frederic S. The Economics of Money, Banking, and Financial Markets. 1998.
Purposes and Functions. Board of Governors of the Federal Reserve System. 1994. Available at: http://www.federalreserve.gov/pf/pf.htm.
U.S.Monetary Policy: An Introduction, Federal Reserve Bank of San Francisco, Economic Research Department, 1999. /publications/federalreserve/monetary/index.html.