First, let’s talk about why consumer credit is so important before discussing consumer credit data. The availability of credit supports consumer spending for larger items that can’t as easily be bought with cash, such as vehicles, furniture, appliances, and other large durable goods. Financing for other types of consumer spending, everything from tuition to vacations, is also affected by the availability and cost of credit. Thus, credit availability directly affects consumer spending, which in turn accounts for around 70% of gross domestic product (GDP) or the total output of the U.S. economy.1
Monitoring trends in consumer credit
From Dr. Econ’s perspective, one of the best sources for monitoring the dramatic changes in consumer credit in 2008 is the Federal Reserve’s Consumer Credit Report. This report, also known as the monthly G.19 Release, tracks overall consumer credit outstanding both by lender type and by the prevailing terms (such as interest rates) on key types of consumer credit (defined as loans not secured by real estate). Moreover, since these data are normally published only five business days after the end of the month being reported, they are a valuable source of current information on consumer credit conditions. Monthly interest rates for several categories of loans from commercial banks are reported: 48-month new car loans, 24-month personal loans, and credit card loans. Automobile finance companies report key information about new car loans: interest rates, maturity of loans, loan-to-value ratios, and the amount financed in dollars.
These data provide a wealth of information. Changes in total consumer credit outstanding provide an important measure of credit growth. Terms on interest rates, loan size, loan-to-value ratios, and maturity of loans can give economists and borrowers important insights into the ease or difficulty of obtaining credit.
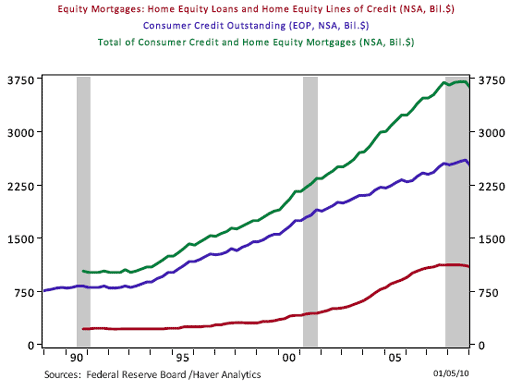
It is important to point out that the Consumer Credit Report does not include loans made as home equity loans and home equity lines of credit, a category of credit that is an important vehicle for providing financing for consumers who have equity in their homes. In fact, in the early 2000s, as house prices appreciated rapidly many homeowners were able to increase their borrowing by using home equity lines of credit or by ‘cash out’ refinancing that allowed them to convert some housing equity into cash. Those avenues of consumer finance have played a larger role in consumer borrowing in recent years, as can be seen in Figure 1, which shows trends in both outstanding consumer credit (blue series), home equity loans and home equity lines of credit (red series), and the total for both types of credit (green series). However, the long upwards trends in both types of lending to consumers came to an end with the financial crisis and ensuing recession.
Figure 1. Growth Trends for Consumer Credit and Home Equity Lending
Analyzing the credit crunch
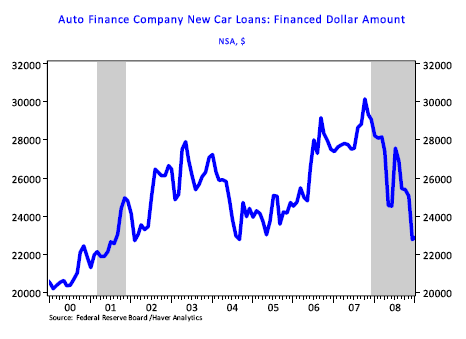
The financial crisis that started in August 2007 resulted in a “credit crunch” that made it more difficult for many consumers to finance purchases.2 Households faced more stringent credit standards from lenders and had to pay higher interest rates on credit. In addition, the declines in house prices and equity (stock) prices in recent years greatly reduced household wealth. In their efforts to realign their balances sheets, consumers have increased their saving rate and reduced their spending. The negative impact on consumer credit outstanding became apparent in 2008, as credit outstanding began to fall dramatically in the second half of the year (Figure 2). Terms on new car loans from auto finance companies illustrate one factor contributing to the decline: on average it became more difficult and more costly for households to get auto financing. Interest rates on new car loans increased late in the year (Figure 3), rising from an average of under 5% in the first quarter of the year to a peak of 8.42% in December. Terms on consumer loans became more restrictive from the first quarter of the year to the last: loan-to-value ratios (see Figure 4), the amount of the purchase price financed, fell from about 94% to only 86% on average. Over the same period, the typical new car loan fell from $28,200 to $24,400 (see Figure 5). These changes tended to make it more expensive to finance a new car and certainly contributed to the dramatic slowdown in light vehicle sales in 2008. First-quarter 2008 vehicle sales totaled 3.8 million units, but by the fourth quarter of 2008 fewer than 2.6 million units were sold.
Slower sales and reduced production of vehicles in turn contributed to the sharp decline in GDP in the last quarter of 2008. Finally, many consumers faced higher rates and more restrictive terms not only on consumer loans but also on home equity borrowing,3 further amplifying the impact on the real economy.
During this period the economy faced an “adverse feedback loop” in which financial distress reduced credit availability and helped push the economy into a deeper recession. As the economy weakened and jobs were lost, the recession led to further rounds of credit restrictions that resulted in even less spending on consumer goods and services than before. This, in turn, led to further reductions in output and jobs. The Consumer Credit report provides evidence of how lending terms tightened and consumer credit contracted in 2008 as this process unfolded.
Figure 2. Total Consumer Credit Started Falling in the Second Half of 2008
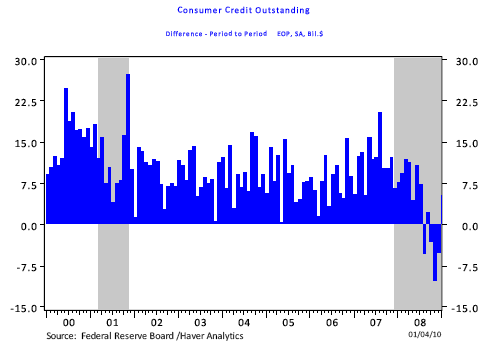
Figure 3. Interest Rates on New and Used Car Loans Spiked in 2008
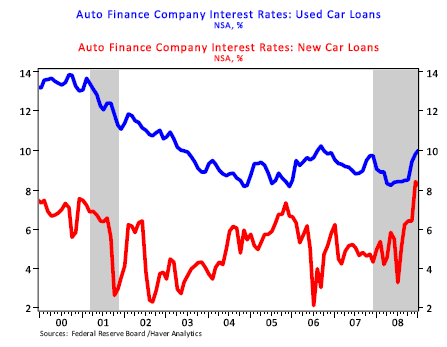
Figure 4. Loan-to-Value Ratio for New Car Loans Also Tightened in 2008
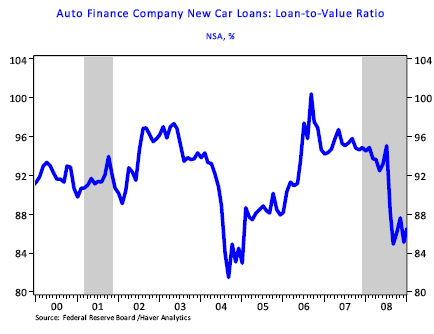
Figure 5. Average New Car Loan Size Fell as Loan Terms Tighten
Which lenders are lending?
The Consumer Credit report provides a breakdown of consumer credit outstanding for both revolving (credit card) and nonrevolving loans by major categories of lenders, including commercial banks, finance companies, and others.
Summary
So, you can see that the vast amount of information on consumer lending gathered in the Consumer Credit report makes it a valuable resource. By carefully looking at the behavior of consumer credit in the aggregate, trends in loan terms, and lending patterns by key holders of credit, economists can paint a much clearer picture to help evaluate movements in other key economic variables like consumer spending. Going forward, economists and analysts will continue to watch the report for signs of improvement in consumer credit that could benefit the overall economy.
References
Consumer Credit. Federal Reserve Statistical Release, G.19. Board of Governors of the Federal Reserve System.
Flow of Funds. Federal Reserve Statistical Release, Z.1. Board of Governors of the Federal Reserve System.
End Notes
1. The gray bars in the following charts represent recessions as defined by the National Bureau of Economic Research or NBER.
2. For additional information, please link to the Federal Reserve Bank of San Francisco website: The Economy: Crisis & Response.
3. Home equity loans and lines of credit are not reported as part of consumer credit in this report. A good source of information on these is the Federal Reserve’s Flow of Funds Release, Z.1 Release, Outstandings, Table L.218, Home Mortgage.