The aggregate unemployment rate provides important information to policymakers. In fact, I discussed the rise in the national unemployment rate in a recent (January 2010) response. However, information on changes in the unemployment rates among different sub-groups is also important and can aid in the understanding of the movements of the overall unemployment rate. Researchers and policymakers realize this and, in addition to looking at aggregate labor market indicators, they examine various disaggregated statistics – for instance, by demographic characteristics, region or industry. In this response I will focus on unemployment rates by demographic groups and show that the recent ‘Great Recession,’ as it has been called by some, has had a broad-based impact on virtually all segments of the labor market. Yet, the data also make it clear that some groups have been impacted more than others.
Where can I find disaggregate labor market data?
The Bureau of Labor Statistics (BLS) provides detailed labor market data. In terms of demographic characteristics of the labor force, data disaggregated by age, gender, race and educational attainment are readily available (although data for some sub-groups goes further back than for others).
Who is most affected by the labor market downturn?
Unemployment rate by gender
Let’s begin by looking at unemployment rates by gender. Chart 1 shows the gender-specific unemployment rates for the post- World War II period (in this and all charts, gray bars indicate recessions as defined by the National Bureau of Economic Research 1). As is evident from the chart, this recession is marked by a large difference in unemployment rates, with the rate for men exceeding that for women.
Chart 1

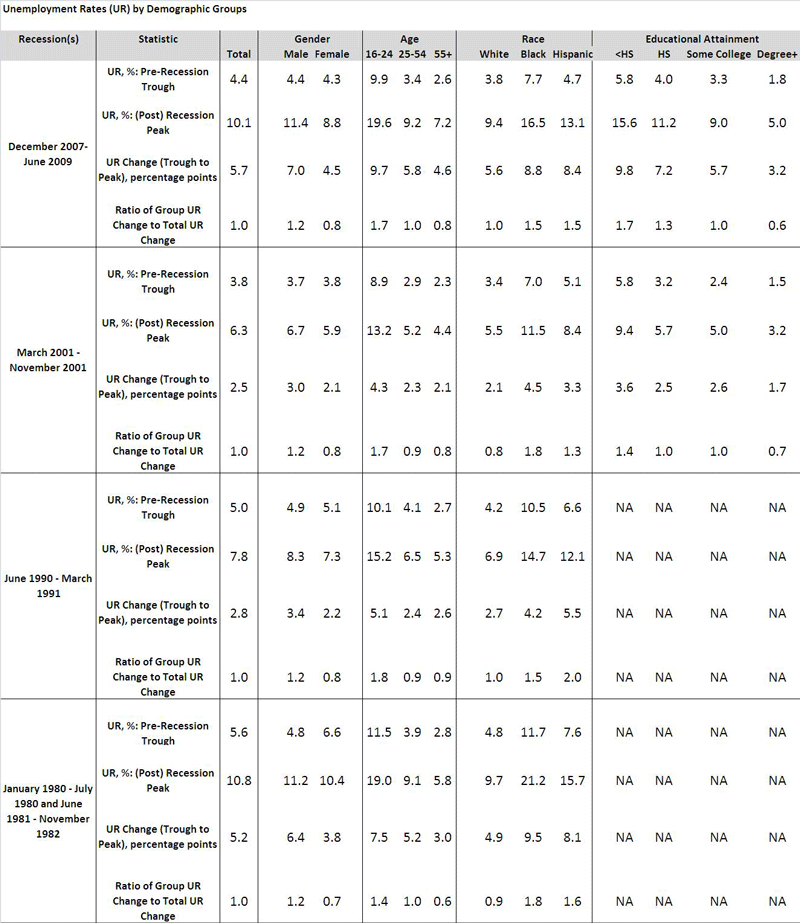
Table 1 shows pre-recession peaks and post-recession troughs for unemployment rates for the most recent business cycle and three previous cycles. The table shows total unemployment rates as well as unemployment rates for the four demographic groups analyzed here. At its peak (reached in August 2009), the unemployment rate difference between males and females stood at 2.7 percentage points (with unemployment rates of 11 percent and 8.3 percent for males and females, respectively), which is the largest gender unemployment rate gap we have seen in the post-war period.
Note that since the early 1980s the gender-specific unemployment rates moved in close concert, with the unemployment rate for females tending to be slightly below that for males. During recessions, however, male unemployment rates increased by more than that for females. Table 1 shows the trough-to-peak increase in unemployment rates during downturns. As you can see, for each of the downturns shown the increase in the male unemployment rate exceeded that for females.
The table also shows the ratio of demographic-group specific unemployment rate increases to the total unemployment rate increase. Note that if that ratio were 1 for each demographic group, the unemployment rate increase would have been distributed uniformly across demographic groups. However, you can see that in each of the downturns shown the ratio is above 1 for men and below 1 for women, indicating that, by this metric, the impact of downturns on men was disproportionately larger.
Table 1 (View larger image)

The difference between male and female unemployment rates was particularly large during the 2007-2009 downturn. Researchers attribute the large increase in the difference in gender unemployment rates to two factors (Sahin et. al 2010). First is industry segregation: men tend to be employed in industries that are more sensitive to business cycle swings, such as manufacturing and construction, and therefore men suffered larger job losses than women. This factor also contributed to the greater sensitivity of the unemployment rate for males in other recessions. The second factor is an increase in the share of men who joined the labor force but were not able to find a job in the recent cycle. That is, some men who were not in the labor force (for definitions and details on how unemployment rate is measured please consult my May 2007 response) were prompted by the weak economy to begin a job search. During the most recent three recessions, the flow of workers from non-participation to unemployment always increased, and the size of this increase was roughly comparable for men and women (see Fraciz and Ilg 2009). However, the particular feature of this recession is that men experienced a much steeper increase in flow from non-participation to unemployment than women. It is hypothesized that declines in wealth and liquidity drove some non-participants in the labor market (retirees and students) to look for work (see Daly, Kwok and Hobijn 2009).
Unemployment rate by age
Chart 2 shows the unemployment rate by age categories provided by the BLS. Here I’ve broken it down into three groups: younger workers (under 25), prime-aged workers (25 to 54), and older workers (55 and over). One well-documented fact that is immediately obvious from the figure is that unemployment rates for young workers tend to be much higher (two-to-three times) than unemployment rates for older workers. This is due to the nature of young people’s employment – they tend to be employed in temporary positions, have short tenure, and are more likely to be employed in industries sensitive to the business cycle swings (like retail trade and leisure and hospitality). As is also shown, all age groups experienced a noticeable increase in unemployment rates during the current downturn. However, the increase for the younger workers has been steeper. The greater sensitivity of the unemployment rate for younger workers was evident in past recessions (please see Table 1) and likely reflects many of the same factors that contribute to higher average unemployment rate for the young.
Chart 2

Unemployment rate by race
In Chart 3 we plot the unemployment rate among three major race categories reported by the BLS: black, Hispanic and white. Note that unemployment rates for ethnic minorities have consistently been higher than those for whites. During the recession that started in 2007, the unemployment rate for blacks surpassed 16 percent, the rate for Hispanics reached 13 percent, while the rate for whites peaked at 9.4 percent.
Chart 3

Ethnic minorities tend to experience more pronounced increases in joblessness during downturns. Declines in demand during economic downturns typically have a larger impact on the employment prospects of less-skilled workers (and this will also be evident from my discussion of unemployment rate by education attainment that follows). On average, black and Hispanic workers have less education and job skills than whites (Carpenter and Rodgers 2004). As is shown in Table 1, the peak-to-trough unemployment rate increase for black and Hispanic workers was greater than that of whites during all of the recessions shown. Table 1 indicates that black and Hispanic workers bore a disproportionately higher share of unemployment rate increases during this recession. However, by this metric, their burden was even higher during the two recessions of the early 1980s.
Unemployment rate by educational attainment
Chart 4 graphs the BLS’s unemployment rate for four groups by educational attainment: less than high school, high school graduates, some college but no bachelor’s degree, and bachelor’s degree holder or higher. As is well documented, groups with lower educational attainment have higher unemployment rates. Also, less educated workers tend to experience steeper increases in unemployment rates during recessions (see Table 1), and the most recent downturn was no exception (although these data, which are published by the BLS, only goes back until 1994, we are still able to compare this recession with the prior recession of 2001). In comparison to the recession of 2001, the impact of the recent recession on less-educated workers is more pronounced. One way to see this is to look at the ratio of the unemployment rate change for the less-educated workers to the total unemployment rate change. The ratio is higher for those with a high school diploma or less education than it was in the previous downturn, indicating that the less-educated are being more disproportionately affected by the current downturn.
Chart 4

Conclusion
By all measures, in 2009 and 2010 the labor market is operating at its worst since the Great Depression. Job growth, unemployment rates, unemployment spells, and many other measures are at historic highs (or lows) across the board. However, as badly as the overall labor market is performing, some segments of the labor force are facing even harder times: males, younger workers, the less educated, and those from ethnic minorities.
For more information on the financial crisis, the Fed’s monetary policy response, and the recovery, please see the Federal Reserve Bank of San Francisco website, The Economy: Crisis & Response.
For more reading on the labor market, see:
Carpenter, Seth and William M. Rodgers III. 2004. The Disparate Labor Market Impacts of Monetary Policy. Journal of Policy Analysis and Management, Vol. 23, No. 4, 813-830 .
Daly, Mary, Joyce Kwok and Bart Hobijn. 2009. Labor Supply Responses to Changes in Wealth and Credit. FRBSF Economic Letter 2009-05.
Elsby, Michael W., Bart Hobijn, and Aysegul Sahin. 2010. The Labor Market in the Great Recession. Prepared for Brookings Panel on Economic Activity, March 18-19, 2010 (version of April 15, 2010).
Frazis, Harley and Randy Ilg. 2009. Trends on Labor Force Flows During Recent Recession. Monthly Labor Review Online.
Maloney, Carolyn B. 2010. Understanding the Economy: Unemployment Among Young Workers. A report by the U.N. Congress Joint Economic Committee.
Sahin, Aysegul, Song, Joseph, and Hobijn, Bart. 2010. The Unemployment Gender Gap during the 2007 Recession,Current Issues in Economics and Finance, Vol. 16, No. 2.
For more on BLS statistical releases, see:
Bureau of Labor Statistics, Employment Situation.
End Notes
1. For more on recession dating, see NBER: and my May 2002 and June 2003 column.