
The Paycheck Protection Program (PPP) was established by the Coronavirus Aid, Relief, and Economic Security (CARES) Act to help small businesses keep their workers on payroll during the pandemic-related closures. After significant PPP lending activity earlier in the year, which played an outsized role on 12th District banks’ balance sheets, lenders started to unwind these holdings in late 2020.
Paycheck Protection Program 2020: Top three takeaways
- PPP drove bank loan growth throughout much of 2020.
- PPP forgiveness reduced quarterly loan growth in late 2020 but helped income as banks accelerated fee recognition.
- Banks in the West continued to report the highest average exposure to PPP loans among all Federal Reserve districts.
Negative loan growth in Q4
PPP forgiveness and muted loan demand weighed on net loan growth. Net loan growth remained high because of the 2020 rollout of PPP, but average year-over-year net loan growth slowed to 18% by year-end. PPP forgiveness ramped up in 2020’s 4th quarter (4Q20), more than offsetting growth in other categories among most District banks, and pushing the District’s average quarter-over-quarter net loan growth rate into negative territory for the first time since 2013. Among non-PPP loans, average problem loan ratios were low but ticked up slightly, and some surveyed senior loan officers expressed concern about 2021 loan performance.
District banks’ average quarterly return on average assets ratio improved in 4Q20, in part because PPP forgiveness accelerated recognition of fee income, lifting asset yields.
Slower pace of forgiveness in the Twelfth District
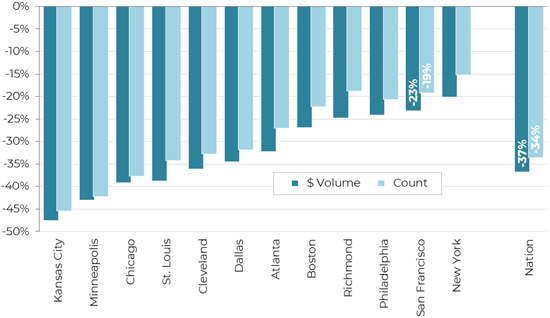
During the fourth quarter, 12th District banks shed 23% of the dollar volume of PPP loans on average, a slower pace than most other districts, but from a comparatively higher base. From a concentration-to-capital and reserves standpoint, at 62%, Twelfth District banks continued to report the highest average PPP concentration in the nation. In contrast, banks based in districts in the Midwest tended to hold among the lowest concentrations and the fastest rates of decline in PPP loans.
Figure 1. The average pace of decline in 12th District PPP holdings vs. other parts of the nation
For more details on real estate across the District, visit the full First Glance 12L 4Q20 report.
Image credit: mphillips007 via iStock.
You may also like:
The views expressed here do not necessarily reflect the views of the management of the Federal Reserve Bank of San Francisco or of the Board of Governors of the Federal Reserve System.