
Residential real estate is one of the hottest topics in the 12th District since the onset of the COVID-19 pandemic, and Q1 was no exception. Housing inventory has become exceptionally tight, and construction costs increased, causing a slowdown in sales. Home price growth continued as mortgage interest rates remained relatively low. As a result, single-family price-to-rent ratios in the Mountain and Pacific Census divisions increased the most across the nation, raising the prospect of a price correction. Here’s a deeper dive into the factors driving residential real estate conditions in the District.
Supply and demand
There are several supply and demand dynamics driving increases in home prices. The Mountain states saw particularly strong demand due to a combination of relatively more affordable prices and, anecdotally, a surge in coastal residents with higher purchasing power that took advantage of new work-from-home arrangements. This was a continuation of the pre-pandemic trend, as the 2020 Census showed that Utah and Idaho experienced the fastest population growth in the nation since 2010.
Figure 1
Home Prices versus Inventory, March 2020 to March 2021
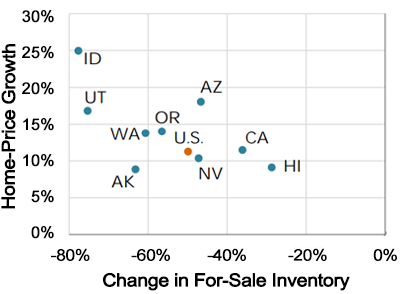
Another factor in demand for homes is the Millennial generation entering their prime home-buying years, switching from renting in the pandemic to seeking their own homes. Meanwhile, during the height of the pandemic, construction costs rose due to supply-chain bottlenecks and as current homeowners opted to upgrade their existing homes rather than move and find a replacement home in a very hot housing market. This consumer behavior was linked to low for-sale inventory in Q1.
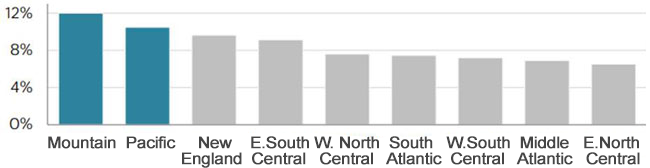
Figure 2
Home-Price Growth Less Owners’ Equivalent Rent Growth by Census Division, March 2020 to March 2021
Multifamily real estate
In contrast to the single-family housing market, multifamily price-to-rent ratios have been more stable in the District during the pandemic. However, coastal markets saw falling prices and rents while inland markets strengthened. The San Francisco Bay Area, in particular, saw large price and rent declines as higher-income renters migrated out of the city and moved inland and to the Mountain state markets.
Before the pandemic, inland renters were already relatively more cost burdened. Between 2010 and 2019, rents grew faster than median renter-household income in the same markets that experienced the fastest rent growth since the onset of the pandemic—including Riverside, Tucson, Sacramento, and Phoenix.
Trouble on the horizon?
Higher rents in inland and Mountain state markets may lead to more cost-burdened tenants facing difficulties to make rent payments in the absence of relief. Some homeowners and renters remain at risk of foreclosure or eviction as roughly 10 percent of households nationally reported that they were late on mortgage or rent payments, based upon data from a late-April Census Bureau Household Pulse survey.
Among states in the District, mortgage and rent that is overdue tended to be more common in tourism and energy-reliant economies like Hawai’i, Nevada, and Alaska. Furthermore, the Center for Disease Control and Prevention’s eviction moratorium and similar measures in some states and localities are currently set to expire this year. Federal rent relief programs could assist some tenants in the future, although possibly not in proportion to their financial stress.
For more details on real estate across the District, visit the full First Glance 12L 1Q21 report.
Photo credit: Art Wager via iStock
You may also like:
The views expressed here do not necessarily reflect the views of the management of the Federal Reserve Bank of San Francisco or of the Board of Governors of the Federal Reserve System.