
As the COVID-19 pandemic disrupted the economy last spring, core personal consumption expenditures (PCE) inflation fell dramatically. One year later, the opposite is occurring, with core PCE inflation surpassing 3%.
Is this recent upward inflation pressure transitory, representing pandemic-related price movements? Or is this an indication of more persistent broad-based inflation trends?
Which price movements are directly related to pandemic disruptions?
A potentially revealing indicator to address these questions is the San Francisco Fed’s Inflation Sensitivity to COVID-19 series. The data show contributions to core PCE inflation by their degree of sensitivity to the economic disruptions caused by the pandemic.
The PCE price index is the inflation measure targeted by the Federal Open Market Committee; “core” PCE removes food and energy products, which are historically very volatile and tend to cloud the underlying trend in inflation (Stock and Watson 2016).
Our inflation indicators divide the categories of core PCE inflation into components that are sensitive and insensitive to the pandemic. COVID-sensitive components include categories where either prices or quantities changed significantly at the onset of the pandemic, between February and April 2020. COVID-insensitive components include all other core PCE categories.
Price changes in the COVID-sensitive categories are more likely to be driven by disruptions directly related to the pandemic. Such disruptions include mandatory and voluntary social distancing measures, pandemic-related government policies, and supply chain bottlenecks. Hospital services, restaurant services, and physician services are among the largest of these categories.
Price changes in the insensitive group are less likely to be directly impacted by such factors; they include large categories such as housing services, pharmaceutical products, and charges for financial services. Details of the methodology are described in Shapiro (2020).
Figure 1 depicts the contributions of these two components to year-over-year core PCE inflation since 2019. In February 2020, the 1.9% core PCE inflation rate was about equally divided between COVID-sensitive and COVID-insensitive components. The contribution of the sensitive component fell precipitously by over 0.7 percentage point (pp) in April 2020. This represented a majority of the 1pp decline in core PCE inflation that month.
Figure 1
Contributions to core PCE inflation according to sensitivity to COVID
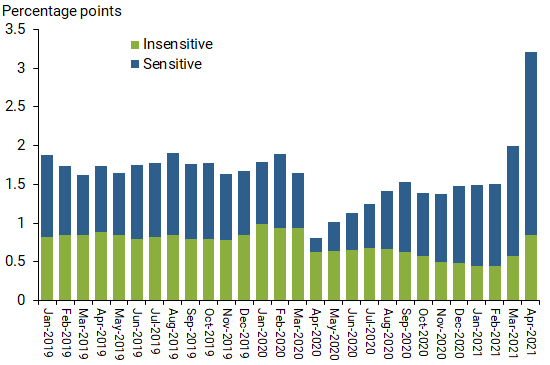
The COVID-sensitive component has rebounded dramatically since bottoming out in April 2020. Its contribution to core PCE inflation increased to 1.1pp in January 2021, then surged to 2.4pp in April 2021. This component now contributes 1.7pp more to core PCE inflation than it did on average between 2015 and 2019. During the same time span, the contribution from the COVID-insensitive component to core PCE inflation was unchanged.
What’s driving the increase in COVID-sensitive inflation?
The recent rise in inflation is attributable to the same COVID-sensitive categories that declined the most during the onset of the pandemic last spring. Assessing individual categories within the COVID-sensitive component shows that much of the increase in inflation comes from two categories: health-care services and used cars and trucks.
Figure 2
Categories with highest contributions to COVID-sensitive inflation
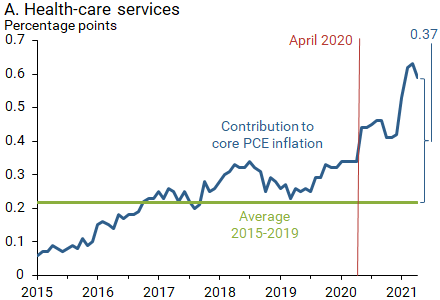
Health-care services
Health-care services is one of the largest components of core PCE inflation, representing close to 20% of core expenditures. Panel A of Figure 2 shows the contribution of health-care services to core PCE inflation since 2015. In the five years preceding the pandemic, health-care services contributed approximately 0.22pp on average to core PCE inflation.
The prices of health-care services in the PCE price index are based on payments made by health insurers to providers, such as physicians and hospitals. As the single largest payer to health-care providers, Medicare directly contributes to measurable changes in health services inflation. Furthermore, changes in Medicare prices tend to spill over directly into private prices, impacting overall health-care services inflation (Clemens, Gottlieb, and Shapiro 2014).
A number of pandemic-related legislated changes to Medicare payments have gone into effect over the past year. These include a 20% add-on payment for COVID treatments, a temporary moratorium of the 2013 Medicare sequestration 2% payment cuts, and a temporary 3.75% increase in payments to physicians. Overall, these factors have led to a 0.6pp increase in the contribution of health-care services, triple its average contribution between 2015 and 2019.
Importantly, these payment changes are temporary and are expected to either roll off or reverse by early 2022. Thus, what is now a boost to inflation coming from health-care services is likely to become a drag by next year.
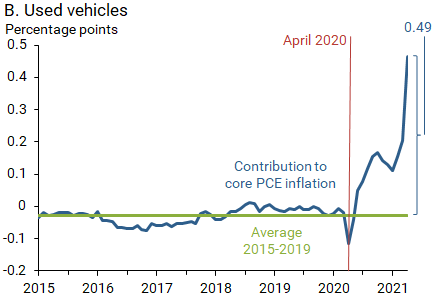
Used autos and trucks
Panel B of Figure 2 shows the contribution of used autos and trucks to core PCE inflation since 2015. Owing to this category’s very stable prices, its contribution hovered close to zero between 2015 and 2019. In April 2020, prices became strikingly volatile. The contribution declined to to -0.1pp but then reversed course and began surging upwards.
A steady increase in the demand for cars, in tandem with a shortage of semiconductors—a key production input for new cars—led to severe upward price pressure for used vehicles. Overall, the contribution of used vehicles to core PCE inflation has surged to 0.5pp, significantly higher than its pre-pandemic contribution.
It remains unclear how long car production will remain constrained, however, a consensus of market participants expect some easing by the second half of 2021 (Fitch 2021, IHS Market 2021).
How persistent will the recent inflation increase be?
The recent sharp increase in measured inflation is unlikely to persist beyond this year. The increase is being driven by spending categories where prices fell the most last spring. Furthermore, much of the surge in the COVID-sensitive component is due to health-care services and used vehicles—categories in which evidence suggests recent price increases will be temporary. The remaining COVID-sensitive categories include many products where prices increased likely for temporary reasons. For example, a shift in demand towards low-risk products boosted the prices of products that can be used at home, such as furniture and household appliances (Shapiro 2021). Prices for those types of products are not likely to keep increasing at such a rapid pace as the economy returns to pre-pandemic conditions.
Still, some risks for higher inflation exist. More recently, the prices of higher-risk economic activities such as air travel and hotels have risen as the economy began to reopen. This could push inflation higher as demand continues to shift back to services more broadly. Furthermore, supply chain bottlenecks could last longer than anticipated, pushing prices even higher for some products. More generally, the recent high inflation episode risks raising longer-run inflation expectations among businesses, altering current and future price-setting behavior.
These upward pressures could offset some of the expected pricing effects when the temporary inflation in health-care services, used vehicles, and other COVID-sensitive products begin to ease.
Adam Hale Shapiro is a vice president in the Economic Research Department of the Federal Reserve Bank of San Francisco.
The views expressed here do not necessarily reflect the views of the management of the Federal Reserve Bank of San Francisco or of the Board of Governors of the Federal Reserve System.