
Economic growth at the start of this year is looking soft. However, historical data suggest some of this slowing may simply reflect a statistical anomaly.
The U.S. economy expanded at a strong pace in 2018: the Bureau of Economic Analysis (BEA) estimated that inflation-adjusted, or real, GDP grew about 3% over the year. However, the latest Blue Chip Economic Indicators survey of professional economic forecasters projected growth would drop by half over the first three months of this year. They pegged real GDP growth at just 1.5% at an annual rate for the first quarter of 2019.
In the past, researchers have argued that the first-quarter growth estimates may understate the actual strength of the economy at the beginning of each year because of a statistical anomaly. Usually, the raw data used for calculating real GDP exhibit strong seasonal fluctuations that occur at about the same time each year due to such things as normal weather variation and holiday schedules. The BEA removes these seasonal fluctuations in order to help uncover business cycle variation. However, the recurring low estimates for first-quarter growth suggested that the seasonal adjustment of real GDP was incomplete. Specifically, by insufficiently accounting for the seasonal fluctuations, real GDP understated growth early in the year and overstated growth later in the year. This so-called “residual seasonality” clouded assessments of the state of the economy.
Last year, in response to such evidence, the BEA changed its seasonal adjustment procedures. These changes corrected much of the problem, so the evidence for remaining residual seasonality in the revised estimates of real GDP is weaker (Wright 2018). Still, there is some chance that the reported first-quarter growth estimates—even after seasonal adjustment—may remain persistently lower than they should be. One way to correct this would be to remove any remaining residual seasonality using a second seasonal adjustment. This can be applied to the BEA’s seasonally adjusted real GDP series, following the methods suggested in Rudebusch, Wilson, and Mahedy (2015) and Rudebusch, Wilson, and Pyle (2015). This “double” seasonal adjustment can gauge the extent to which residual seasonality still affects first-quarter GDP growth estimates.
The technique provides different seasonal adjustment factors for each quarter that vary over time. Figure 1 shows first-quarter seasonal adjustment factors for 2003 through 2018. If there were no residual seasonality in the published real GDP, then these seasonal factors would be essentially zero. Instead, in recent years, the correction pushes first-quarter real GDP growth almost ½ percentage point higher than the published numbers.
Figure 1
Changes to first-quarter real GDP growth from a second seasonal adjustment
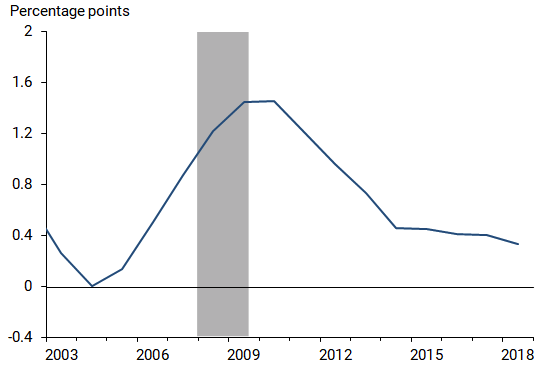
For 2019, this upward adjustment suggests that actual first-quarter growth is somewhat stronger than what the professional forecasters are predicting and what the BEA is expected to report. Conversely, future real GDP growth readings would therefore slightly overstate true growth on average in the second, third, and fourth quarters of this year.
Glenn D. Rudebusch is senior policy advisor and executive vice president in the Economic Research Department of the Federal Reserve Bank of San Francisco.
References
Rudebusch, Glenn D., Daniel J. Wilson, and Tim Mahedy. 2015. “The Puzzle of Weak First-Quarter GDP Growth.” FRBSF Economic Letter 2015-16 (May 18).
Rudebusch, Glenn D., Daniel J. Wilson, and Benjamin Pyle. 2015. “Residual Seasonality and Monetary Policy.” FRBSF Economic Letter 2015-27 (August 24).
Wright, Jonathan. 2018. “Seasonal Adjustment of NIPA Data.” NBER Working Paper 24895.
The views expressed here do not necessarily reflect the views of the management of the Federal Reserve Bank of San Francisco or of the Board of Governors of the Federal Reserve System.