
The disruptions caused by COVID-19 abruptly changed people’s daily lives, from where they went to the types of products they bought. Public health mandates and voluntary social distancing kept consumers away from economic activities with higher risk of virus transmission, such as restaurants and hotels. Instead, people began spending more on products that could be used at home, such as furniture and household appliances.
This broad shift away from services and towards goods occurred at the same time that global supply chains were severely disrupted. Shipping delays and production lags created difficulties for some suppliers trying to keep up with the increase in goods demand. These supply bottlenecks have been associated with higher prices for products such as semiconductors and lumber, which are direct inputs into many consumer goods. The surge in the demand for goods and the accompanying pricing pressure from supply bottlenecks have raised concerns about a sustained period of heightened overall inflation.
Weighing the differential impact of the pandemic on goods and services
One way to assess the size of the shift is to consider what spending and price dynamics would have looked like in the absence of the pandemic. A plausible assumption is that the patterns would have looked similar to those in the five years before the pandemic. I use this as a basis for comparison.
Figure 1
Goods and services spending and price levels relative to pre-pandemic trend
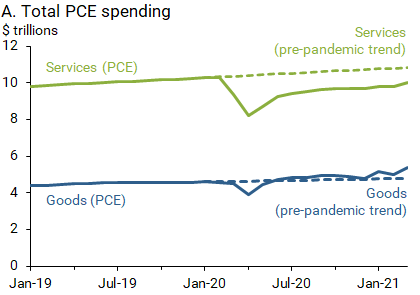
Panel A of Figure 1 shows personal consumption expenditures (PCE) separated into two broad categories, goods (blue solid line) and services (green solid line). Also shown are the pre-pandemic spending trends for those categories (dashed lines), measured as the average growth in spending for the five years before the pandemic.
Goods spending fell sharply at the onset of the pandemic but recovered very quickly. The most recent data in March 2021 show spending for goods has risen to 13% above its pre-pandemic trend. This means that goods spending is plausibly above what it would have been in the absence of the pandemic. By contrast, services spending has been much slower to recover and currently is 8% below its pre-pandemic trend.
Because services represent a larger share of the PCE—averaging 70% over the five years before the pandemic—the shortfall in services spending outweighs the large increase in goods spending. Thus, despite a surge in goods spending, overall spending shows a net shortfall of $234 billion below pre-pandemic trends at an annual rate.
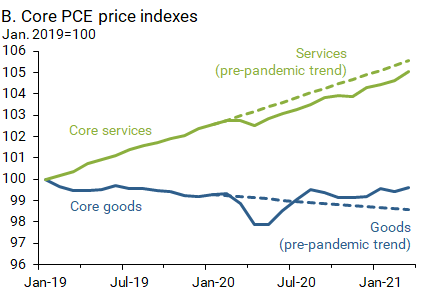
The changes in the price level patterns are nearly a mirror image to those of consumer spending. Panel B of Figure 1 shows the price levels of core goods (blue solid line) and services (green solid line), adjusted to equal 100 in January 2019. The core measure removes food and energy products, which are historically very volatile and have been shown to cloud the underlying trend in inflation (Stock and Watson 2016).
Both goods and services prices declined sharply at the onset of the pandemic. Similar to spending patterns, the price level of goods in March 2021 was higher than its pre-pandemic trend (blue dashed line), while the price level of services was below its pre-pandemic trend (green dashed line). Due to several factors, including persistent technological improvements and strong global competitive pressure, goods prices have been trending down since the mid-1990s (Copeland and Shapiro 2016).
Weighing the differential impact of goods and services prices on core PCE inflation
To assess how these price dynamics have shaped core PCE inflation, one must consider each category’s share of PCE. Services represent a larger share of the core PCE basket than goods. Thus, any movements in the service price level will, by construction, cause a larger change in core PCE inflation than movements in the goods price level.
Figure 2 shows the contributions to year-over-year core PCE inflation over the past two years, broken down between goods and services. This type of contribution decomposition takes into account each category’s respective share or “weight” (Shapiro 2020). The consistently higher pace of price growth for services combined with its higher weight has historically contributed the majority of core PCE inflation.
The most recent PCE data are no different. Approximately 1.6 of the 1.8 percentage points of year-over-year core PCE inflation in March 2021 came from services. Although core goods inflation is relatively high, it still contributes only 0.2 percentage point to current year-over-year core PCE inflation.
Figure 2
Contribution to core PCE inflation from goods and services
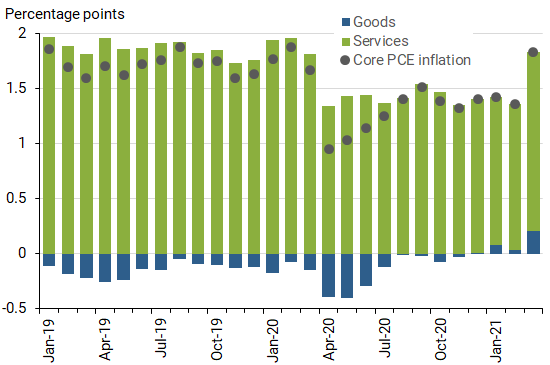
Gray dots reflect total core PCE inflation as the sum of the two components.
| Date | Goods | Services | Total core PCE inflation |
|---|---|---|---|
| 1/1/2019 | -0.11 | 1.97 | 1.86 |
| 2/1/2019 | -0.18 | 1.88 | 1.70 |
| 3/1/2019 | -0.22 | 1.82 | 1.59 |
| 4/1/2019 | -0.25 | 1.96 | 1.71 |
| 5/1/2019 | -0.24 | 1.86 | 1.62 |
| 6/1/2019 | -0.14 | 1.86 | 1.72 |
| 7/1/2019 | -0.15 | 1.91 | 1.76 |
| 8/1/2019 | -0.05 | 1.92 | 1.87 |
| 9/1/2019 | -0.09 | 1.82 | 1.73 |
| 10/1/2019 | -0.10 | 1.85 | 1.75 |
| 11/1/2019 | -0.13 | 1.73 | 1.59 |
| 12/1/2019 | -0.12 | 1.75 | 1.63 |
| 1/1/2020 | -0.17 | 1.94 | 1.76 |
| 2/1/2020 | -0.08 | 1.96 | 1.88 |
| 3/1/2020 | -0.15 | 1.81 | 1.66 |
| 4/1/2020 | -0.39 | 1.34 | 0.95 |
| 5/1/2020 | -0.40 | 1.43 | 1.03 |
| 6/1/2020 | -0.29 | 1.44 | 1.14 |
| 7/1/2020 | -0.12 | 1.37 | 1.25 |
| 8/1/2020 | -0.01 | 1.41 | 1.41 |
| 9/1/2020 | -0.02 | 1.54 | 1.52 |
| 10/1/2020 | -0.07 | 1.46 | 1.39 |
| 11/1/2020 | -0.03 | 1.35 | 1.32 |
| 12/1/2020 | 0.01 | 1.39 | 1.40 |
| 1/1/2021 | 0.08 | 1.34 | 1.42 |
| 2/1/2021 | 0.03 | 1.33 | 1.36 |
| 3/1/2021 | 0.21 | 1.62 | 1.83 |
Assessing the role of supply bottlenecks
There is some risk that the effects of supply bottlenecks could eventually reach the service sector. For example, rising lumber prices raise the cost of construction, which could eventually be passed on to consumers in the form of higher rental prices. However, empirical evidence suggests that increases in input prices tend to pass through more when they are closer to the final product (Shapiro 2008 and Hobijn, Nechio, and Shapiro 2021). This means that most of the price changes due to supply bottlenecks are likely to be absorbed before they ever reach services.
While some pandemic-related supply bottlenecks have pushed up prices for consumer goods, their smaller share in the PCE price index mitigates the degree of overall inflation risk. As social-distancing restrictions are pulled back and the economy normalizes, people are likely to shift their spending back to services. This may push down goods prices and push up prices for some services closer to trend, such as airlines and hotels, reversing some of the recent transitory inflation trends.
Adam Hale Shapiro is a vice president in the Economic Research Department of the Federal Reserve Bank of San Francisco.
Photo credit: shaunl via iStock
You may also be interested in:
The views expressed here do not necessarily reflect the views of the management of the Federal Reserve Bank of San Francisco or of the Board of Governors of the Federal Reserve System.