President Williams presented similar remarks to the Economic Association of Australia, Eminent Speaker Series at Australian National University in Canberra, Australia on June 28, 2017.
President Williams presented similar remarks to the Economic Association of Australia, Eminent Speaker Series at University of Tasmania School of Business and Economics in Hobart, Australia on July 6, 2017.
Introduction
It is a pleasure to have the opportunity to join you here today. We in the San Francisco Bay Area feel a special kinship to the people of Sydney. Our cities are two of the world’s great metropolises, known for their sweeping waterfronts, iconic bridges, and unique architecture. Also, both our cities are chilly in June and July—only you have the excuse at least that it’s winter here.
Among our other commonalities is a mutual stake in the economic well-being of the other, and in the well-being of the broader community of nations in an increasingly interconnected world. In this regard, an important new trend is emerging. Even as countries make strides in recovering from the global financial crisis, growth remains lackluster.
More specifically, as attention has been focused on combatting crises and economic downturns, shifting supply-side realities have been developing that are holding back growth across the globe. Demographic factors like slowing population and labor force growth and a global productivity slowdown are fundamentally redefining what is achievable and creating a new set of economic challenges.
These challenges have ramifications that extend beyond the next few months or years—they will define the economic landscape for the next decade and beyond. In a broader sense, they’re also about the next generation, and what sort of future we choose to create together. The focus of my remarks today will be on the causes and consequences of this global growth slump.
Spoiler alert: When you look at the underlying demographic and productivity-related shifts, it becomes clear that a sea change is taking shape. What’s less clear is how global policymakers will respond to these shifts…whether they will make the necessary long-term investments in priorities like education, job training, science, and infrastructure that can break this slump…or whether they will allow this slump to break them.
Before I go even one word further, it should be noted that the views expressed are mine alone and do not necessarily reflect those of others in the Federal Reserve System.
Crisis & Recovery
The narrative of the past decade has been one of crisis and recovery.
Today, many nations are still coping with the aftermath of the global financial crisis, the euro area crisis, and other events. Central banks remain engaged in the extraordinary policy actions they undertook to stabilize their economies and to support economic recovery.
There are encouraging signs that we are approaching a turning point; a transition from recovery to ongoing economic expansion. The United States is a case in point.
The U.S. economy has regained, and even surpassed, full employment benchmarks. Although our inflation rate is still somewhat below our 2 percent medium-term target, I and my colleagues on the Federal Open Market Committee expect us to reach that goal in the next year or so.1 As a result, we at the Federal Reserve are now in the process of gradually withdrawing the massive monetary stimulus put in place during the past decade.
And we’re not alone in this improving outlook. When you look at the economic news coming out of Europe and Japan, for instance, you see economic indicators moving in the right direction.
But wait a second, isn’t this supposed to be a speech about the global growth slump?
The big dichotomy of our times is that in country after country, the economic news is at once both encouraging and discouraging: encouraging that economies are expanding; discouraging that growth is disappointing, at least by historical standards.
In the United States this dichotomy is profound. U.S. GDP growth has been almost as unimpressive as employment has been impressive. In the nearly eight years since the recession ended, real GDP growth has averaged only about 2 percent, well below former trends, while we’ve added an impressive 15 million jobs. How can both be true?
Shifting Winds
As I said at the beginning of my remarks, a sea change in sustainable growth is under way, driven by fundamental shifts in demographics and productivity growth.
I’ll start with demographics. Two powerful trends are evident: We are generally living longer but birth rates are declining.
The good news is that people are living longer on average. Overall life expectancy in member countries of the Organisation for Economic Co-operation and Development (OECD) has increased from about 60 years in the 1950s to nearly 80 years today (Figure 1).2 And it is expected to grow even higher, eventually exceeding 90 years later this century.
Figure 1: Shifting Demographics
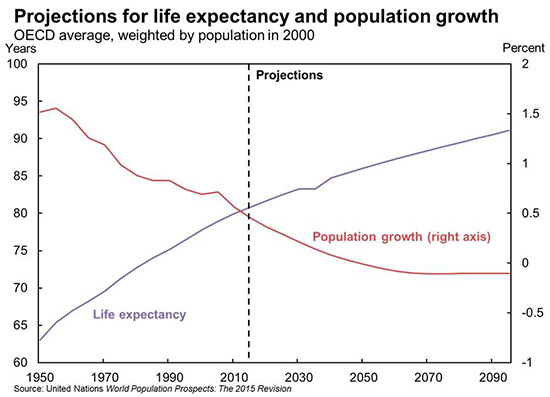
Despite this increase in longevity, population growth is slowing to a standstill owing to falling birth rates. Among the so-called advanced economies that belong to the OECD—which includes Australia—population growth averaged over 1 percent back in the 1950s and 1960s, but is now running under ½ percent per year, as shown in Figure 1.3 United Nations projections show population growth in this group of countries actually turning negative some 20 years from now.
When it comes to productivity, the changes that are occurring in advanced economies across the world are no less dramatic. In the United States, the catchphrase is “productivity slowdown.” Labor productivity—the amount produced per worker hour—in the United States has been growing a little over 1 percent per year over the past decade, well below half the rate of the prior decade (Figure 2).
Figure 2: U.S. Productivity Slowdown
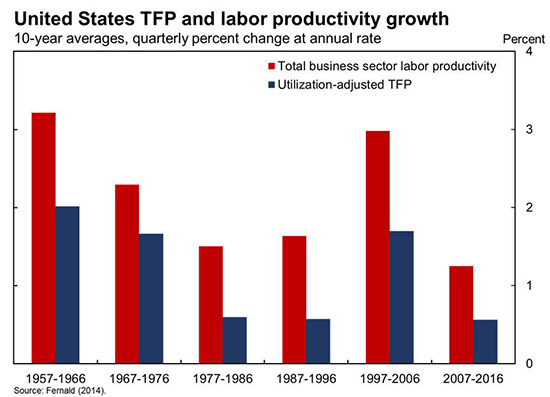
The recent pattern of subdued productivity growth is a throwback to that seen from the mid-1970s through the mid-1990s. And a major factor driving the slowdown in the two periods is the same: very slow growth in what economists call “total factor productivity,” or TFP for short (Figure 2). TFP is the measure of productivity that remains after one accounts for changes in the quality of the workforce and the amount of capital investment in the economy, and is often thought to be a measure of innovation and technology.
Some commentators blame the apparent productivity slowdown on failures of economic statistics to keep up with changing times, pointing to the widespread adoption of mobile technology, social media, the gig economy, and so on. Careful study of this issue, however, reveals that these developments present no greater difficulties in measuring productivity than those from the past: that is, the productivity slowdown is real.4
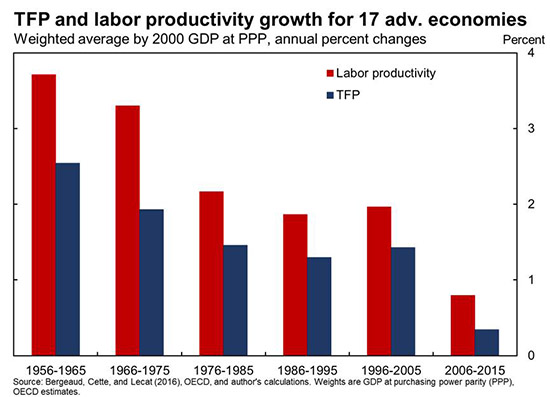
The recent productivity slowdown is not confined to the United States, but rather is a global phenomenon. Averaging over 17 advanced economies—again, including Australia—productivity growth has fallen to below 1 percent per year over the past decade, less than half the pace seen over the prior 30 years (Figure 3). 5 As in the United States, a key culprit in the slowdown is a sharp decline in TFP growth.
Figure 3: OECD Productivity Slowdown
Slumping Growth
So what do these trend shifts in demographics and productivity mean for future economic growth? For that question, some math comes in handy. Over the medium term, the sustainable growth rate of the economy equals the sum of productivity growth and the growth rate of labor supply. Therefore, the slowdown in productivity growth translates one-for-one into a slowdown in sustainable GDP growth.
Demographics are also holding back rather than boosting economic growth. The decline in population growth eventually implies slower labor force growth. In addition, longer life expectancy combined with more time in school means that people are spending a decreasing share of their lifetimes in the labor force. These two demographic waves are driving labor force growth toward zero, or even below that, in countries like Japan. Even the United States, which historically has enjoyed high rates of labor force growth, is expected to see labor force growth of only ½ percent per year over the next decade, a significant drop from the past. 6
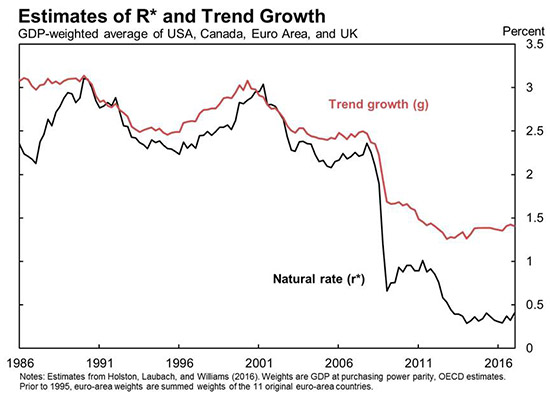
These global shifts in demographics and productivity tell us that the growth we have been seeing in recent years, and thinking of as “disappointing,” “anemic,” and “tepid” when compared to years past, is a harbinger of the future. Research by Kathryn Holston, Thomas Laubach, and myself aims to quantify the new normal for growth. The estimated trend growth rate for GDP for four economies—Canada, the euro area, the United Kingdom, and the United States—now stands at about 1½ percent, less than half what it was 30 years ago (Figure 4). The corresponding estimate for the United States alone is about 1½ percent, broadly consistent with other estimates.7
Figure 4: The Decline in R*
Policy Implications
So these are some of the causes of sluggish growth…what are some of the consequences?
For starters, the demographic waves and slower growth have driven down the longer-term normal or “natural” real rate of interest—or r-star—to historic lows in country after country.
Slower trend growth reduces the demand for investment, while longer life expectancy tends to increase household saving.8 This combination of lower demand and higher supply for savings, along with other factors, has pushed down the “price” of savings, or r-star. With open capital markets, global developments affect r-star in every country, irrespective of local economic conditions.
There is mounting evidence of a sizable decline in r-star across economies. Estimates for the United States indicate that r-star has fallen to between 0 and 1 percent.9 The weighted average of estimates for Canada, the euro area, the United Kingdom, and the United States has declined to less than ½ percent. That’s 2 percentage points below the average natural rate that prevailed in the two decades before the financial crisis (Figure 4). Estimates for Japan are also near zero.10 These r-star estimates differ by economy, but in all cases the most recent estimates are among the lowest over the past 30 years.11
A striking aspect of these estimates is that they show no signs of moving back to previously normal levels. Looking ahead, given the demographic waves and sustained productivity growth slowdown around the world, I do not expect r-star to revert to higher levels anytime soon.
The dramatic decline in r-star presents significant challenges for monetary policy and financial stability. In particular, the global nature of the decline in r-star implies that central banks will face daunting challenges in stabilizing their economies in response to negative shocks when interest rates are not far above their lower bound.12
In a low r-star world, what were once called “extraordinary” policies—like zero or negative interest rates, forward guidance, and balance sheet policies—are likely to become the norm as central banks strive to achieve their macroeconomic goals.
Therefore, policymakers around the globe need to prepare for the challenges of successfully navigating new realities.13 In the best of all worlds, fiscal and other policies would be put in place that propel long-run economic prosperity and boost r-star on a sustained basis. More on this in a moment. Absent such actions, monetary policy will be severely challenged to achieve stable prices, well-anchored inflation expectations, and strong macroeconomic performance in a low r-star world.
Therefore, monetary policymakers will need to prepare for the next storm by taking appropriate actions in advance to design and commit to a more resilient monetary policy framework that is robust to a low r-star world. It’s imperative to study and debate these issues now rather than wait until the next storm hits.
Another set of consequences of the global slump will be felt by fiscal and other public policymakers worldwide. Unless the trend lines improve, they will likely find that they are repeatedly being asked to do more with less; in some cases much less. Many will face dramatic increases in unfunded liabilities such as pensions and safety net programs.
Countries that fail to act today will find their challenges getting even more severe tomorrow. With the sea change underway, we no longer have the luxury of taking a wait-and-see approach.
This begs the question, what does said action look like?
As a monetary policymaker, I wish I could tell you that it’s within the purview of central banks to solve all this; that the answer lies in raising or lowering interest rates.
Reality, unfortunately, dictates otherwise.
Our long-term challenges are going to require the sort of long-term investments that fiscal policymakers—and private investors—have within their own toolkits: Investments in education, job training, infrastructure, research and development…all the things that propel an economy and prosperity over the longer term.
Conclusion
My perspective is that of a statistician and economist rather than a politician or columnist: The data and the analysis tell the same story of a fundamental sea change in the global economy.
While the causes of the global growth slump are well defined, the consequences are yet to be written—and they will ultimately be shaped by choices that policymakers are grappling with across the globe. And, ultimately, the choices made by any one of our nations will impact all of our nations.
Thank you.
End Notes
1. Board of Governors (2017); see the median inflation projection.
2. This is not true for all population groups; Case and Deaton (2017) document declining life expectancy for middle-aged, less-educated non-Hispanic whites in the United States since the year 2000.
3. United Nations (2015).
4. Byrne, Fernald, and Reinsdorf (2016).
5. Bergeaud, Cette, and Lecat (2016). Download data.
6. Congressional Budget Office (2017).
7. Fernald (2016).
8. Carvalho, Ferrero, and Nechio (2016), Gagnon, Johannsen, and Lopez-Salido (2016), and Eggertsson, Mehrotra, and Robbins (2017).
9. Williams (2017b).
10. Fujiwara et al. (2016).
11. Holston, Laubach, and Williams (2016).
12. Caballero, Farhi, and Gourinchas (2016) and Eggertsson et al. (2016).
13. Williams (2016, 2017a).
References
Bergeaud, Antonin, Gilbert Cette, and Rémy Lecat. 2016. “Productivity Trends in Advanced Countries between 1890 and 2012.” Review of Income and Wealth 62(3), pp. 420–444.
Board of Governors of the Federal Reserve System. 2017. “FOMC Projections Materials.” June 14.
Byrne, David M., John G. Fernald, and Marshall B. Reinsdorf. 2016. “Does the United States Have a Productivity Slowdown or a Measurement Problem?” Brooking Papers on Economic Activity, Spring, pp. 109–157.
Caballero, Ricardo J., Emmanuel Farhi, and Pierre-Olivier Gourinchas. 2016. “Global Imbalances and Currency Wars at the ZLB.” Unpublished manuscript, March 11.
Carvalho, Carlos, Andrea Ferrero, and Fernanda Nechio. 2016. “Demographics and Real Interest Rates: Inspecting the Mechanism.” European Economic Review 88, pp. 208–226.
Case, Anne, and Angus Deaton. 2017. “Mortality and Morbidity in the 21st Century.” Brookings Papers on Economic Activity, conference draft (March).
Congressional Budget Office. 2017. “The Budget and Economic Outlook: 2017 to 2027.” Report, January.
Eggertsson, Gauti B., Neil R. Mehrotra, and Jacob A. Robbins. 2017. “A Model of Secular Stagnation: Theory and Quantitative Evaluation.” National Bureau of Economic Research Working Paper 23093.
Eggertsson, Gauti B., Neil R. Mehrotra, Sanjay R. Singh, and Lawrence H. Summers. 2016. “A Contagious Malady? Open Economy Dimensions of Secular Stagnation.” National Bureau of Economic Research Working Paper 22299.
Fernald, John G. 2014. “A Quarterly Utilization-Adjusted Series on Total Factor Productivity.” Federal Reserve Bank of San Francisco Working Paper 2012-19.
Fernald, John. 2016. “What Is the New Normal for U.S. Growth?” FRBSF Economic Letter 2016-30 (October 11).
Fujiwara, Shigeaki, Yuto Iwasaki, Ichiro Muto, Kenji Nishizaki, and Nao Sudo. 2016. “Developments in the Natural Rate of Interest in Japan.” Bank of Japan Review 2016-E-12 (October).
Gagnon, Etienne, Benjamin K. Johannsen, and J. David Lopez-Salido. 2016. “Understanding the New Normal: The Role of Demographics.” Board of Governors of the Federal Reserve System Finance and Economics Discussion Series 2016-080. http://dx.doi.org/10.17016/FEDS.2016.080
Holston, Kathryn, Thomas Laubach, and John C. Williams. 2016. “Measuring the Natural Rate of Interest: International Trends and Determinants.” Federal Reserve Bank of San Francisco Working Paper 2016-11, December.
United Nations, Department of Economic and Social Affairs, Population Division. 2015. World Population Prospects: The 2015 Revision, Key Findings and Advance Tables. New York: United Nations.
Williams, John C. 2016. “Monetary Policy in a Low R-star World.” FRBSF Economic Letter 2016-23 (August 15).
Williams, John C. 2017a. “Preparing for the Next Storm: Reassessing Frameworks and Strategies in a Low R-star World.” FRBSF Economic Letter 2017-13 (May 8).
Williams, John C. 2017b. “Three Questions on R-star.” FRBSF Economic Letter 2017-05 (February 21).