
The decline in the natural rate of interest, or r-star, over the past decade raises three important questions. First, is this low level for the real short-term interest rate unique to the U.S. economy? Second, is the natural rate likely to remain low in the future? And third, is this low level confined to “safe” assets? In answer to these questions, evidence suggests that low r-star is a global phenomenon, is likely to be very persistent, and is not confined only to safe assets.
There is an emerging consensus that the real natural rate of interest—that is, the inflation-adjusted short-term interest rate expected to prevail when the economy is operating at its full potential, or r* (r-star) for short—has declined over the past decade in the United States (Laubach and Willams 2016, Kiley 2015, Lubik and Matthes 2015, Johanssen and Mertens 2016). This development has important implications for the conduct and efficacy of monetary policy (Ball et al. 2016, Williams 2016). A less studied, but equally important issue is the potential deleterious effects of low r-star for financial stability. A world characterized by very low, and at times negative, interest rates could have adverse long-term consequences for financial sector profitability and increase incentives to reach for yield. This could contribute to a buildup of excessive risk-taking and leverage, pushing asset prices to high levels and perhaps resulting in increased risk to the financial system as a whole (Powell 2017).
In considering the potential implications of low r-star for the economy, monetary policy, and financial stability, it’s not enough to know that the natural rate has fallen; the specifics of the decline matter as well. In this regard, three key questions arise. First and foremost, is the low level of r-star strictly a U.S. phenomenon, related to developments particular to the U.S. economy, or is it more global in scope? Second, is r-star likely to remain low in the future? Third, is the low level of the natural rate confined to low risk or “safe” assets or does it represent a broader decline in asset returns? This Letter addresses these three questions and provides evidence that low r-star is a global phenomenon, is likely to be very persistent, and is not confined only to safe assets.
A global decline in r-star
Empirical evidence of a sizable decline in the natural rate of interest in the United States has accumulated over recent years. The shaded region of Figure 1 shows the range of estimates of the natural rate for 1986 to 2016 based on studies by Laubach and Williams (2003), Kiley (2015), Lubik and Matthes (2015), Johanssen and Mertens (2016), and Holston, Laubach, and Williams (2016). Although individual estimates differ at any point in time, the range of estimates has clearly moved down over the past decade, and all estimates are below 1% at the end of the sample, the third quarter of 2016. The solid line in the figure plots the average of these five estimates over time. This average fluctuated between 2 and 2½% in the 1990s through the mid-2000s, and then plummeted to about ½% around 2009, where it has remained through 2016.
Figure 1
Average and range of five r-star estimates
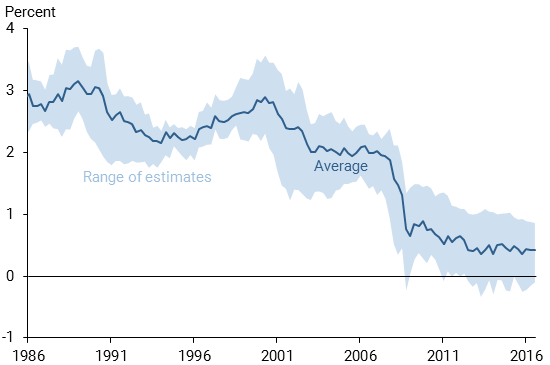
Note: The five estimates are from Laubach and Willams (2003), Kiley (2016), Lubik and Matthes (2016), Johanssen and Mertens (2016), and Holston, Laubach, and Williams (2016)
Estimates of the natural rate are at historically low levels in other major advanced economies as well. Figure 2 plots estimates from Holston et al. (2016) of the natural rate of interest for four economies—Canada, the euro area, the United Kingdom, and the United States—for 1986–2016. The estimates differ by region, but in all four cases, the estimated level of r-star has fallen over the past decade and the most recent estimates are the lowest over the past 30 years. This finding that r-star has fallen to low levels in these four economies is confirmed by other studies cited in Holston et al. (2016).
Figure 2
Estimates of r-star for four economies
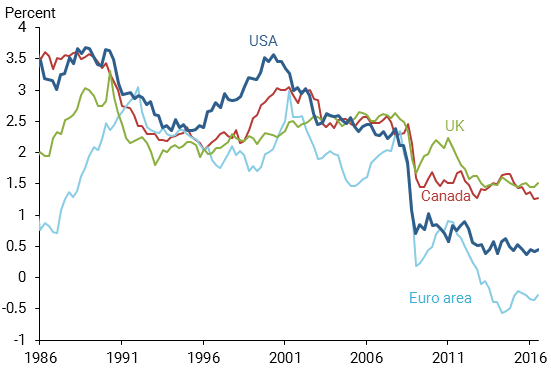
Source: Holston, Laubach, and Williams (2016).
To get a clearer picture of the overall decline in r-star across advanced countries, Figure 3 plots the weighted average of estimates for Canada, the euro area, the United Kingdom, and the United States, where the estimates are weighted by each country’s GDP measured in terms of purchasing power parity. This average level of r-star fluctuated between 2 and 3% through the mid-2000s, and subsequently fell sharply, reaching its current level of about ¼%. Although not included in the figure, estimates of r-star for Japan are also very low, averaging around zero in recent years (Fujiwara et al. 2016).
Figure 3
Average r-star estimates and trend growth for four economies
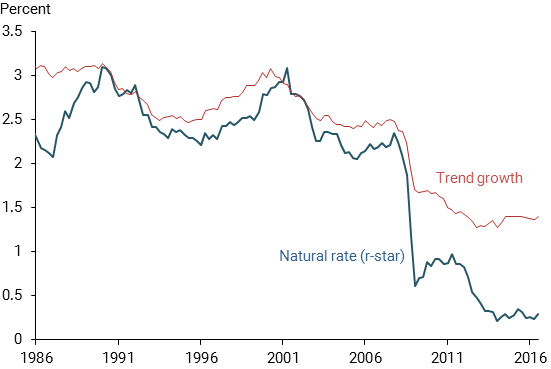
Source: Estimates from Holston, Laubach, and Williams (2016) of GDP-weighted average for United States, Canada, the euro area, and the United Kingdom. Weights are GDP at purchasing power parity, OECD estimates. Pre-1995 euro area weights are total weights of the 11 original euro area countries.
Will r-star remain low in the future?
There are a number of reasons why the decline in the natural rate of interest will not reverse anytime soon. First, over eight years after the onset of the global financial crisis, there are no signs of a return to more historically normal levels of r-star in the estimates reported above. This suggests that these low estimates of r-star are not overly influenced by country-specific cyclical factors, but instead that longer-term global influences are at work. For example, the U.S. economy has fully recovered from the recession following the financial crisis, and the most recent estimates of r-star there have shown no signs of rebounding.
Second, many of the possible factors depressing r-star across countries reflect highly persistent forces affecting the global supply and demand for savings (Council of Economic Advisers 2015, Rachel and Smith 2015, Caballero, Farhi, and Gourinchas 2016). For example, one potential explanation for the decline in r-star is a dramatic slowdown in trend real GDP growth in many advanced economies. Figure 3 reports the Holston et al. (2016) weighted average of estimates of trend growth for the same four economies as before. After averaging between 2½ and 3%, the weighted average of trend growth fell to about 1½% over the past decade. In theory, slower trend growth is associated with a lower demand for savings to fund capital investments needed to sustain growth, implying a lower level of r-star. This linkage between trend growth and r-star is built into the Holston et al. estimates and the slowdown in trend growth explains a large part of the decline in r-star across the four economies. The decline in the trend rate of growth reflects shifts in demographics of the workforce and a slowdown in productivity growth (Fernald 2016). These underlying trends are unlikely to swing back upward in the near future, suggesting continued downward pressure on r-star.
Safe assets vs. a general decline in returns?
Although it is increasingly clear that the natural rate has fallen to a low level in many countries, a great deal of uncertainty and debate remains about the causes and consequences of the decline. One proposed explanation for the low level of r-star over the past decade is heightened demand by international investors for safe assets like government bonds, which has lowered their returns relative to more risky assets (Gourinchas and Rey 2016). One piece of evidence in favor of this hypothesis is that model-based estimates of expected returns on stocks have not fallen over the period of the decline in the natural rate (Duarte and Rosa 2015, Caballero et al. 2016).
Unlike the evidence from models of expected returns to stocks, other evidence suggests that expected returns for a variety of types of assets have fallen along with r-star. Direct evidence on this question is provided by surveys of economists. Each year, the Survey of Professional Forecasters (SPF) asks respondents about their expectations of asset returns from holdings over the next 10 years (Federal Reserve Bank of Philadelphia 2017). Figure 4 shows that SPF expectations of returns to equities and bonds have fallen significantly over the past decade, reaching historical lows in the past few years. Although more volatile, forecasts of returns on T-bills have also fallen, nearing zero in recent years.
Figure 4
SPF forecasts of 10-year real returns
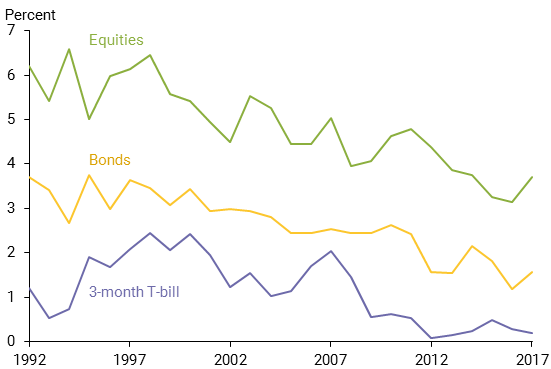
Note: Returns are deflated with SPF long-run consumer price index inflation forecast.
Other measures of returns to risky assets have also declined in line with the fall in r-star, keeping risk spreads relatively stable. For example, the “TED” spread—the difference between the London interbank offered rate or LIBOR and the yield on U.S. T-bills—is often used as a metric of risk in money markets. This has been close to historically normal levels in recent years. The spread between corporate bonds and that of Treasury securities, as measured by excess return to corporate bonds developed by Gilchrist and Zakrajšek (2012), has also been relatively low on average over the past few years. This indicates that corporate bond yields have fallen in line with yields on government debt. Similarly, risk spreads on high-yield corporate bonds and mortgage rates are not currently elevated, as their returns have come down with yields on Treasury securities.
Taken together, this evidence suggests that expected returns on a wide set of assets have declined as r-star has fallen. In addition to the evidence on expected returns, the sizable decline in trend growth across the large advanced economies suggests that forces related to real economic activity are at play in determining the natural rate of interest and that this is not limited to safe assets (Summers 2014). This is not to say that there is no role for heightened global demand for safe assets, but rather that other fundamental global factors also appear to be affecting expected returns more broadly. Overall, it is likely that a combination of real and financial factors have driven the decline in the natural rate around the globe.
Conclusion
The dramatic decline in r-star represents a break from the experience of much of the past 50 years and presents significant challenges for monetary policy and financial stability. In particular, the global nature of the decline in r-star implies that central banks will face daunting challenges in stabilizing their economies in response to negative shocks when interest rates are not far above their lower bound (Caballero et al. 2016, Eggertsson et al. 2016). In a low r-star world, what were once called “extraordinary” policies—like zero or negative interest rates, forward guidance, and balance sheet policies—are likely to become the norm as central banks strive to achieve their macroeconomic goals. Moreover, in a world of persistently very low interest rates, risks to financial stability may be greater than before. Policymakers around the globe need to prepare for the challenges of successfully navigating a low r-star world (Williams 2016).
John C. Williams is president and chief executive officer of the Federal Reserve Bank of San Francisco.
References
Ball, Laurence, Joseph Gagnon, Patrick Honohan, and Signe Krogstrup. 2016. “What Else Can Central Banks Do?” Geneva Reports on the World Economy 18, International Center for Monetary and Banking Studies, CEPR Press.
Caballero, Ricardo J., Emmanuel Farhi, and Pierre-Olivier Gourinchas. 2016. “Global Imbalances and Currency Wars at the ZLB.” Unpublished manuscript.
Council of Economic Advisers. 2015. “Long-Term Interest Rates: A Survey.” July.
Duarte, Fernando, and Carlo Rosa. 2015. “The Equity Risk Premium: A Review of Models.” FRB New York Staff Reports 714, February.
Eggertsson, Gauti B., Neil R. Mehrotra, Sanjay R. Singh, and Lawrence H. Summers. 2016. “A Contagious Malady? Open Economy Dimensions of Secular Stagnation.” NBER Working Paper 22299.
Federal Reserve Bank of Philadelphia. 2017. “Survey of Professional Forecasters, First Quarter 2017.” February 10.
Fernald, John G. 2016. “Reassessing Longer-Run U.S. Growth: How Low?” FRB San Francisco Working Paper 2016-18 (August).
Fujiwara, Shigeaki, Yuto Iwasaki, Ichiro Muto, Kenji Nishizaki, and Nao Sudo. 2016. “Developments in the Natural Rate of Interest in Japan.” Bank of Japan Review 2016-E-12, October.
Gilchrist, Simon, and Egon Zakrajšek. 2012. “Credit Spreads and Business Cycle Fluctuations.” American Economic Review 102(4, June), pp. 1,692–1,720.
Gourinchas, Pierre-Olivier, and Hélène Rey. 2016. “Real Interest Rates, Imbalances and the Curse of Regional Safe Asset Providers at the Zero Lower Bound.” Presented at the 2016 ECB Forum on Central Banking, June.
Holston, Kathryn, Thomas Laubach, and John C. Williams. 2016. “Measuring the Natural Rate of Interest: International Trends and Determinants.” FRB San Francisco Working Paper 2016-11, December.
Johannsen, Benjamin K., and Elmar Mertens. 2016. “A Time Series Model of Interest Rates with the Effective Lower Bound.” Finance and Economics Discussion Series 2016-033, Federal Reserve Board of Governors, April.
Kiley, Michael T. 2015. “What Can the Data Tell Us About the Equilibrium Real Interest Rate?” Finance and Economics Discussion Series 2015-077, Federal Reserve Board of Governors.
Laubach, Thomas, and John C. Williams. 2003. “Measuring the Natural Rate of Interest.” Review of Economics and Statistics 85(4, November), pp. 1,063–1,070.
Laubach, Thomas, and John C. Williams. 2016. “Measuring the Natural Rate of Interest Redux.” Business Economics 51, pp. 257–267.
Lubik, Thomas A., and Christian Matthes. 2015. “Calculating the Natural Rate of Interest: A Comparison of Two Alternative Approaches.” FRB Richmond Economic Brief 15-10 (October).
Powell, Jerome H. 2017. “Low Interest Rates and the Financial System.” Speech at the 77th Annual Meeting of the American Finance Association, Chicago, IL, January 7.
Rachel, Lukasz, and Thomas D Smith. 2015. “Secular Drivers of the Global Real Interest Rate.” Bank of England Staff Working Paper 571, December.
Summers, Lawrence H. 2014. “U.S. Economic Prospects: Secular Stagnation, Hysteresis, and the Zero Lower Bound.” Business Economics 49(2), pp. 65–73.
Williams, John C. 2016. “Monetary Policy in a Low R-star World.” FRBSF Economic Letter 2016-23 (August 15).
Opinions expressed in FRBSF Economic Letter do not necessarily reflect the views of the management of the Federal Reserve Bank of San Francisco or of the Board of Governors of the Federal Reserve System. This publication is edited by Anita Todd and Karen Barnes. Permission to reprint portions of articles or whole articles must be obtained in writing. Please send editorial comments and requests for reprint permission to research.library@sf.frb.org