COVID-19 began to spread across the U.S. in January and February of 2020. In early March, state and local governments started to respond by restricting large gatherings, closing schools, and eventually issuing stay at home orders. By March 27, 2020, according to data from Harvard’s Opportunity Insights Tracker, there were 35.5% fewer small businesses open than on January 15, and employment had declined 9.5% relative to that same date. [i] Other estimates suggest that the number of active business owners dropped 22 percent between February and April of 2020, while declines among Black (41 percent), Latinx (32 percent), and Asian (26 percent) businesses were more severe.[ii] President Trump declared a national emergency on March 13, and the Coronavirus Aid, Relief, and Economic Security (CARES) Act was signed into law on March 27, 2020.
As part of the CARES Act, Congress created the Paycheck Protection Program (PPP), $349 billion in conditionally forgivable loans to small businesses. This aid was quickly exhausted, and the program was extended on April 24 by an additional $320 billion. The initial rounds of program stopped accepting new applications on August 8, 2020. The PPP allowed eligible businesses (typically those with less than 500 employees) to apply for loans guaranteed by the Small Business Administration (SBA) for amounts up to 2.5 times monthly payroll. The majority of these loans were meant to pay employee salaries, and businesses who spent the loans within the program’s parameters can apply for loan forgiveness. Though the SBA guaranteed the loans, small businesses had to apply for these loans through participating banks and credit unions, Community Development Financial Institutions (CDFIs), or fintech firms.
The Economic Aid to Hard-Hit Small Businesses, Nonprofits and Venues Act (the “Economic Aid Act”) passed in late December 2020 authorized a third round of PPP loans. This legislation authorized new PPP loans for small business owners who had not obtained loans during the first two rounds of PPP and allowed some borrowers who had already applied for PPP over the spring and summer to apply for a second loan. Responding to criticisms of the program (covered in more detail below), the SBA limited participation in the first days of the program to SBA-designated Community Financial Institutions, and then to small lenders, before opening applications to all lenders in the second week of the program. The SBA is also setting aside pools of money for applicants through these early lenders, for the smallest businesses (10 or fewer employees), and for loans below $250,000 made in low- or moderate-income (LMI) neighborhoods.
Though PPP loans provided an important resource to keep many small businesses afloat, the program was easier for some businesses to access than others. Many banks prioritized existing customers, and many small business owners without prior relationships to banks struggled to find a participating lender.[iii] Fintech lenders often stepped into this gap but were initially excluded from originating the PPP loans and were instead required to partner with a traditional bank.[iv] Additionally, some argued that banks were incentivized to work with larger small businesses as those loans would provide more fees to the banks while smaller businesses would be more likely to struggle to provide the appropriate documentation for loan forgiveness, making using the program more challenging to the smallest businesses.[v] Finally, the program’s framework made saving jobs a key priority (hence its name, the Paycheck Protection Program) by requiring that a significant majority of the loan amount be used to cover payroll expenses in order to be eligible for forgiveness. For capital-heavy businesses or those where rent and inventory are a large share of monthly expenses, like some restaurants, the program had a more limited utility.
Estimates vary as to what share of eligible businesses received loans through PPP, though data from the U.S. Census Bureau’s Small Business Pulse Survey suggest that more than 70% of small businesses received PPP loans. However, given the variation in the ease of accessing the program, it is also important to consider the geographic dispersion of PPP loans. If particular communities had fewer businesses accessing PPP—whether due to lack of local bank branches or the type of small businesses located in that community—the economic effects of COVID-19 may be more severe. Additionally, these areas may struggle more during the economic recovery if more businesses have failed, fewer goods and services are available, and more storefronts are vacant. An analysis of PPP loans, particularly with respect to their geography, industry, and lending channel, can help indicate which communities were underserved by the program and highlight areas of opportunity for continued small-business support. This brief will provide information on PPP lending in the Twelfth Federal Reserve District (Twelfth District), highlighting overall lending patterns and examining lending by zip code income. Using the accompanying state fact sheets and downloadable data table, local stakeholders can identify gaps in small-business support in their communities.
Data and methods used to analyze PPP lending
The data on PPP loans comes from the August 8, 2020 SBA release, and include information at the zip code level on PPP loans made in the first two rounds of the program. These data include information on the name and address of the business (only for entities which borrowed more than $150,000), the size of the loan (exact amount for loans below $150,000, and ranges for larger loans), the lender that provided the loan, and the small business’ estimate of the number of jobs that this loan would help retain. The SBA also released data on the demographics of the business owner (gender, race/ethnicity, and veteran status), but 76% of borrowers did not report data for any of these (10% reported race/ethnicity, 21% gender, and 15% veteran status). In addition to this limitation, reporting has called into question the accuracy of the data, finding instances of unlikely job numbers or business owners who claim to have not applied to PPP.[vi] Despite these limitations, the SBA data remains the most comprehensive reporting available on the PPP program and is being used by researchers across the country to examine lending patterns.
In order to more easily compare zip codes with varying business densities, this analysis uses a “coverage ratio” of PPP loans to businesses using data from the U.S. Census’s 2018 Zip Code Business Patterns (ZBP).* It uses the number of establishments with less than 500 employees as a proxy for PPP eligibility. Though some establishments with fewer than 500 employees would not have been eligible for PPP (because they are part of a business with too many employees across all locations to be PPP eligible), the ZBP data are an underestimate of eligible businesses in most cases because the data exclude sole proprietorships, independent contractors, and self-employed persons who were able to apply to PPP. As a result, the coverage ratio can be greater than 100% due to either more small businesses in early 2020 than in 2018 when the ZBP was collected, or due to businesses that were excluded from the ZBP data.
Demographic data at the zip code level are drawn from the 2014-2018 American Community Survey (ACS). Zip codes in the PPP data that do not match the ACS data (either due to data entry error, having no population, or being a new zip code that is not yet reflected in the ACS data) are excluded from analysis that includes demographics but included in all other analyses. Zip codes are defined as LMI if their median incomes are less than 80% of the median income of their metropolitan statistical area (MSA); middle-income zip codes have incomes of 80-120% of the median, and high-income zip codes are at or above 120% of the median. Zip codes which are not part of an MSA are excluded in the income analysis (less than 7% of loans in the Twelfth District are in zip codes not in an MSA). Within the Twelfth District, 25.9% of zip codes are LMI, 46.4% are middle income, and 27.8% are high income. In 5 MSAs, there are no zip codes classified as LMI, and in 9 there are none classified as high income (in one MSA—Fairbanks, Alaska—all zip codes are middle income).
Zip codes are categorized as majority-white or majority-minority. Out of 70 MSAs in the Twelfth District, 23 have no majority-minority zip codes; this is also true of 30 out of 56 micropolitan areas. Hanford-Corcoran, CA MSA has no majority-white zip codes. Among zip codes not included in an MSA or micro area, 114 of 627 are majority-minority.
PPP lending in the Twelfth District
Most loans were small loans, and were made in metro areas
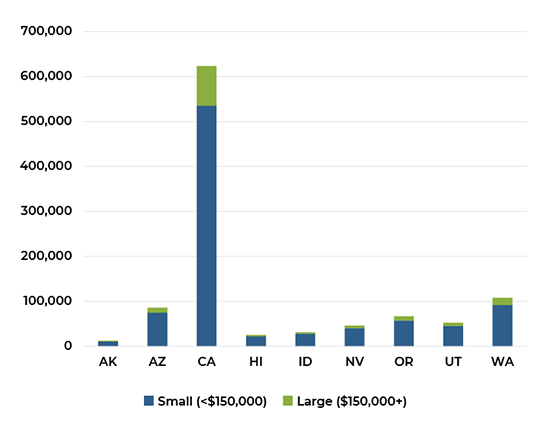
1,049,411 PPP loans were made across the Twelfth District’s nine states: Alaska, Arizona, California, Hawaii, Idaho, Nevada, Oregon, Utah, and Washington. Around 86% of those loans were for less than $150,000 (what the SBA considered a small loan); this trend held across states, with the small loan share ranging from 85.2% of loans in Washington to 89.3% in Idaho. Within states, the vast majority of loans were concentrated in metropolitan statistical areas (MSAs), followed by those in micropolitan areas (areas with urban cores of less than 50,000). Only in Alaska was a large share of loans located in zip codes not near an urban core (28.5%), though Idaho (7.1%) and Utah (5.0%) also had significant shares of non-urban loans.
The SBA reports data on loan size differently for loans above and below $150,000, which means that an average loan size cannot be computed. Among small loans, the average loan was $34,264, and this varied little across states. The median loan size was $20,833, which suggests that many loans went to sole proprietorships, independent contractors, or self-employed individuals, since this is the maximum amount for which those types of businesses were eligible. Among larger loans, those of $150,000-$350,000 were most common, representing 57.8% of large loans, followed by loans between $350,000-$1 million (30.1%).
Many businesses received loans, but large pockets of need remain
Although ZBP data are not a perfect correlate with PPP-eligible businesses, they are nevertheless useful to estimate the approximate share of businesses that received PPP. These shares are overestimates, as non-employer businesses received PPP loans and are not counted in the ZBP data (and small establishments owned by firms too large to qualify for PPP are less common than non-employer businesses). As a result, low PPP coverage ratios can highlight areas where small businesses were particularly challenged in obtaining PPP loans. In the Twelfth District, roughly 63.7% of small businesses received loans, and the median zip code saw 62.5% of its small businesses receive PPP. Across the nine states in the Twelfth District, Washington and Oregon have the smallest share of small businesses that received PPP (at 56.2% and 56.7%, respectively), while in Hawaii approximately 77.7% of small businesses received PPP loans. Though more than half of small businesses received PPP loans in most zip codes, there is a substantial share of zip codes where loans were much less accessible. In 4.6% of zip codes, less than a quarter of small businesses received PPP, and in another 20.1% between a quarter and half of small businesses obtained loans. Alaska and Arizona had the greatest share of underserved zip codes, where less than half of small businesses received funding in more than 37% of zip codes.

Retail, accommodations, and food services businesses received fewer loans than expected
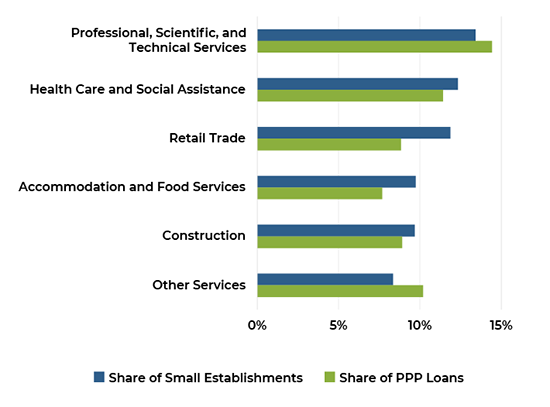
Utilization of PPP by industry varied and was not always proportionate to the number of small establishments in each sector. The largest number of loans went to businesses in Professional, Scientific, and Technical Services; Healthcare and Social Services; and Other Services (which encompasses service-providing industries not covered in other designations). These sectors are among the largest in the Twelfth District among small establishments. However, Retail Trade and Accommodation and Food Services both represent a larger share of small establishments than Other Services yet received fewer loans, despite being sectors that were heavily impacted by coronavirus shutdowns. In fact, in nearly all Twelfth District states, businesses in Retail Trade and Accommodation and Food Services received fewer PPP loans than would have been expected given their prevalence among establishments of this size.
Large banks and fintechs originated most PPP loans in the District
PPP applications were processed through banks and credit unions, CDFIs, and fintech companies (who often partnered with banks). Across the Twelfth District, Bank of America, JPMorgan Chase Bank, and Wells Fargo Bank made the greatest number of loans. Four banks that partnered with fintech firms—Cross River Bank, Celtic Bank, Customers Bank, and WebBank—were also among the top 10 lenders by number of loans in the Twelfth District. Two regional banks (Zions Bank and Umpqua Bank) and another national bank (U.S. Bank) round out the top 10 PPP lenders in the district. In Alaska, Hawaii, Idaho, and Utah regional banks were the most likely to originate PPP loans. A combination of national banks and fintechs were the primary PPP lenders in Arizona, California, and Nevada. In Oregon and Washington, large national banks and regional banks provided the largest number of loans.
Businesses in low- and moderate-income zip codes were less likely to receive PPP loans
PPP lending was uneven across zip code income. While LMI zip codes make up more than a quarter of zip codes in the Twelfth District’s 70 MSAs, just 19.1% of PPP loans were made in LMI zip codes. Meanwhile, high-income zip codes, which make up less than 28% of zip codes, received 38.5% of PPP loans. Though LMI zip codes do contain fewer small businesses, on average, relative to high-income zip codes, they received fewer PPP loans than expected given their share of small establishments. Across all LMI zip codes in the Twelfth District, 58.4% of small businesses received PPP loans, while 69.2% of small businesses in high income zip codes obtained PPP loans.
This trend is also reflected in the typical zip code. The median LMI zip code saw just 56.7% of its small businesses receive PPP loans, while the median high-income zip code saw more than 70% of businesses receive loans. There are also stark differences by income at the extremes—the areas where the fewest and greatest number of small businesses accessed PPP loans. In 30.5% of LMI zip codes, less than half of small businesses received PPP loans; this was the case for just 5.5% of high-income zip codes. At the other extreme, less than one-in-five LMI zip codes had at least 75% of small businesses receive loans, while more than a third of high-income zip codes were in this group.
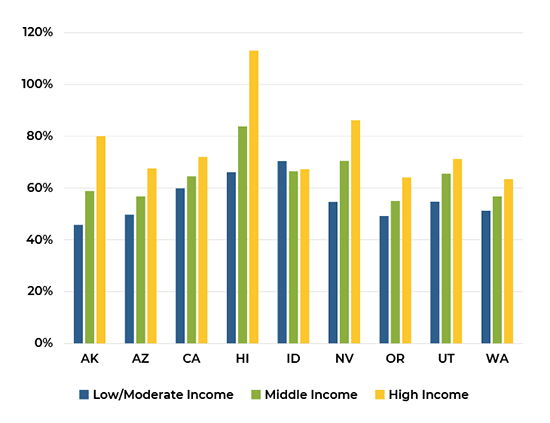
This uneven distribution by zip code income level varied across states in the Twelfth District, though in all states small businesses in LMI zip codes received smaller shares of PPP loans than small businesses in high-income zip codes, in aggregate. The difference in PPP coverage between LMI and high-income zip codes was largest in Hawaii, at 46.9 percentage points at the median, and smallest in California and Washington, at 12.2 percentage points at the medians. In Idaho, the median LMI zip code slightly outperformed the median high-income zip code. However, most LMI zip codes in Idaho had relatively few businesses; the ones with the greatest numbers of small businesses had relatively low coverage ratios.
| State | Low/Moderate Income | Middle Income | High Income |
|---|---|---|---|
| AK | 45.8% | 58.9% | 80.0% |
| AZ | 49.7% | 56.7% | 67.6% |
| CA | 59.8% | 64.5% | 72.0% |
| HI | 66.1% | 83.8% | 1.13% |
| ID | 70.4% | 66.4% | 67.3% |
| NV | 54.6% | 70.5% | 86.2% |
| OR | 49.2% | 55.0% | 64.1% |
| UT | 54.7% | 65.5% | 71.1% |
| WA | 51.2% | 56.7% | 63.4% |
PPP lending patterns by race
Journalists and community advocates reported throughout the summer of 2020 that businesses owned by women and people of color often faced difficulties in accessing PPP loans.[vii] They argued that because businesses owned by people of color are more likely to have few (or no) employees and less revenue, and historical discrimination has limited their access to the banking system (therefore lowering the likelihood of having pre-existing banking relationships), barriers to PPP access were expected to be high among this group.[viii] Several matched-pair audit studies also found different treatment in PPP applications related to the race and gender of the business owner, with minority applicants seeing a “double impact” of both being discouraged from applying and being provided with incomplete information.[ix] Though the SBA also released data on the demographics of the business owner (gender, race/ethnicity, and veteran status), only 10% reported race/ethnicity. This number is insufficient to conduct analysis of lending patterns by race/ethnicity, especially due to possible sources of selection bias in the types of banks and business owners who were more likely to report race/ethnicity in the PPP application.
In the absence of demographic data about the business owners themselves, this analysis mimics the analysis by zip code income level, relying instead on the racial/ethnic makeup of the zip code. These results suggest that PPP lending by the racial/ethnic makeup of the zip code is more even than lending by zip code income across the Twelfth District. The share of PPP loans that went to zip codes where most residents were people of color is roughly in line with the share of small businesses that exist within these zip codes, and the median majority-white zip code had a PPP coverage ratio that was similar to that of the median zip code where predominantly people of color reside.
However, many metro/micropolitan areas in the Twelfth District have no majority-minority zip codes, and many others have just one or two. As a result, comparing lending patterns by zip code using race as a variable can capture effects that are more heavily correlated with the metro/micro area rather than with race, since relatively few areas have majority-minority zip codes. If analysis is restricted to just metro/micro areas where at least 20% of zip codes are majority-minority, inequality begins to emerge. In these metros/micros, 63.7% of small businesses in majority-minority zip codes received PPP loans, while 68.3% of those in majority-white zip codes did; the median zip codes mirror these numbers. Additionally, in diverse metros/micros, while majority-white zip codes were slightly more likely to have less than 25% of their small businesses receive PPP loans (3.6% versus 1.7% in majority-minority zip codes), they were also much more likely to have at least 75% of small businesses receive loans (34.8% versus 26.3% in majority-minority zip codes).
Conclusion
As the pandemic continues and increased cases produce new stay at home orders, many small businesses, even those that received PPP loans during the first two rounds, are struggling to keep their doors open. This analysis highlights areas where the economic impacts may be even more severe, as small businesses in some neighborhoods had a hard time accessing PPP funds. Data provided in the accompanying state fact sheets and downloadable data table (Excel document, 365 kb) can be used to spotlight local areas of need as policymakers, philanthropists, technical-assistance providers, and banks consider where to expend the resources needed for a robust economic recovery. Data from the third round of PPP, which closes March 31, 2021, will help inform whether some of these lending gaps were met and point to continued areas of weakness.
End Notes
* Note: the 2018 ZBP suggests there are 7,824,484 establishments with less than 500 employees in the US, or around 20% more than indicated by the 2017 Statistics of U.S. Businesses (SUSB). This means that using ZBP will produce lower estimates of coverage ratios than the SUSB. However, the SUSB data is not available at the zip code level.
[i] Chetty, Raj et al., “Economic Tracker,” Opportunity Insights Economic Tracker, n.d., accessed December 16, 2020.
[ii] Claire Kramer Mills and Jessica Battisto, “Double Jeopardy: Covid-19’s Concentrated Health and Wealth Effects in Black Communities” (New York, NY: Federal Reserve Bank of New York, August 2020).
[iii] Stacy Cowley, “The Tiny Bank That Got Pandemic Aid to 100,000 Small Businesses,” The New York Times, June 23, 2020, sec. Business; Emily Flitter and Stacy Cowley, “Banks Gave Richest Clients ‘Concierge Treatment’ for Pandemic Aid,” The New York Times, April 23, 2020, sec. Business.
[iv] Cowley, “The Tiny Bank That Got Pandemic Aid to 100,000 Small Businesses”; Paul Sullivan, “What Are Fintechs and How Can They Help Small Business?,” The New York Times, June 10, 2020, sec. Business.
[v] Center for Responsible Lending, “The Paycheck Protection Program Continues to Be Disadvantageous to Smaller Businesses, Especially Businesses Owned by People of Color and the Self-Employed” (Center for Responsible Lending, May 27, 2020).
[vi] Jason Grotto, Zachary R. Mider, and Cedric Sam, “White America Got a Head Start on Small-Business Virus Relief,” Bloomberg.Com, accessed December 18, 2020, Matthew Townsend, and Hannah Levitt, “PPP Data Errors Raise Questions About Relief Effectiveness,” Bloomberg.Com, July 13, 2020.
[vii] Emily Flitter, “Few Minority-Owned Businesses Got Relief Loans They Asked For,” The New York Times, May 18, 2020, sec. Business; Center for Responsible Lending, “The Paycheck Protection Program Continues to Be Disadvantageous to Smaller Businesses, Especially Businesses Owned by People of Color and the Self-Employed.”
[viii] Center for Responsible Lending, “The Paycheck Protection Program Continues to Be Disadvantageous to Smaller Businesses, Especially Businesses Owned by People of Color and the Self-Employed.”
[ix] Anneliese Lederer et al., “Lending Discrimination within the Paycheck Protection Program” (Washington, D.C.: National Community Reinvestment Coalition, July 15, 2020); Anneliese Lederer et al., “Lending Discrimination During Covid-19: Black and Hispanic Women-Owned Businesses” (Washington, D.C.: National Community Reinvestment Coalition, November 10, 2020).
Acknowledgement: Thanks to Ian Galloway and Laurel Gourd for editorial guidance.
The views expressed are not necessarily those of the Federal Reserve Bank of San Francisco or of the Federal Reserve System.
Article Citation
Sanchez-Moyano, Rocio. 2021. “Paycheck Protection Program Lending in the Twelfth Federal Reserve District.” Federal Reserve Bank of San Francisco Community Development Research Brief 2021-1. doi: 10.24148/cdrb2021-01