

Executive Summary
Community Development Financial Institutions (CDFIs) are gaining broader recognition as effective conduits of capital to underserved communities. As a result of the diversity of CDFI business models and their unique approach to blending different capital sources, these mission-driven capital providers have varied and often complex financial structures, and their financial statements can be difficult to understand for those not familiar with the sector. As interest in the sector from prospective investors has grown, so too has the need for broader understanding of how to assess CDFI financial health and soundness. This brief highlights sector dynamics that provide important context for any analysis of individual CDFIs, and shares suggestions for both the CDFI industry and investors new to the sector for how to improve understanding of CDFI financial metrics.
Key takeaways:
- CDFI loan funds are unique entities relative to other financial institutions, and measures of financial health typically used for traditional financial institutions often do not readily map onto the CDFI sector.
- Heterogeneity in the sector makes CDFI loan funds difficult to assess at an industry level; institution-level evaluations are likely to be more fruitful.
- Efforts around standardization of financials have been undertaken by the sector itself in the past but more can be done (both by CDFIs and investors) to increase the understanding of CDFI loan fund financial data by mainstream financial actors.
Note: This research and analysis was conducted in 2022 and 2023 using data from 2017-2021 and predates the new rules for CDFI certification released by the CDFI Fund on December 7, 2023.
Introduction
Community Development Financial Institutions (CDFIs) are gaining broader recognition as effective conduits of capital to underserved communities. CDFIs are both nonprofit and for-profit mission-driven lenders that seek to fill capital gaps by providing flexible financing to communities and individuals not well served by traditional financial systems. CDFIs and their precursors (e.g., community loan funds) have existed in various forms since the 1960s; the CDFI designation was formalized in 1994 through congressional legislation that created the CDFI Fund at the U.S. Department of the Treasury. In recent years, the sector has seen a tremendous influx of capital—especially in the wake of the COVID-19 pandemic—both from government sources (like the CDFI Rapid Response Program) and a growing number of private and institutional investors (e.g., creating liquidity through the California Rebuilding Fund). As of 2022, more than 1,300 certified CDFIs held nearly $247 billion in total assets.i
CDFIs serve a unique function within this country’s financial infrastructure, connecting our hardest-to-reach communities to the financial mainstream. CDFIs are also poised to play an important role in deployment of the billions of dollars of federal funding flowing to America’s communities in the coming years. In addition, as banks respond to new rules for community development investments from the recently revised Community Reinvestment Act (CRA) rule, CDFIs may see renewed interest from CRA-motivated investors. As more sources of capital have become interested in the sector, these new investors and donors have sought to assess CDFIs’ financial stability and performance. However, measures of financial health typically used for traditional financial institutions often do not readily map onto the CDFI sector. It can be challenging, especially for potential new investors, to assess sector financial trends and identify approaches for evaluating a CDFI against its peers. This has limited CDFIs’ ability to scale and attract larger sources of capitalii; additionally, in moments of crisis, like the COVID-19 pandemic, well-understood and standardized financials could have facilitated speedier access to response programs such as the Paycheck Protection Program (PPP).
In this brief, we provide background on the CDFI sector for new investors, grantmakers, and others who have become recently interested in working with CDFIs. We follow this with an exploration of CDFI loan fund financial metrics, drawing from prior research on CDFIs, insights from industry expertsiii, and analysis of proprietary data on the financial metrics of a set of CDFIs. In this exploration, we discuss challenges in doing industry-wide CDFI financial analysis and highlight sector dynamics that provide important context for any analysis of individual CDFIs. We conclude with suggestions for both the CDFI industry and new investors on how to improve understanding of CDFI financial metrics.
What Are CDFIs, and What Makes Them Different?
A key differentiator of CDFIs from other types of financial institutions is their mission to serve low- and moderate-income (LMI) communities that are traditionally not well served by mainstream financial institutions.
Because the financing needs of LMI communities are varied, so, too, are the CDFI models that have emerged to meet those needs. CDFIs can be structured in a variety of ways—as deposit-taking financial institutions (banks and credit unions) or as nondepository institutions (loan funds and venture capital funds). Aside from the venture capital funds, CDFIs provide primarily debt capital to finance a variety of sectors, including affordable housing, small businesses, community facilities, and various consumer credit needs. CDFIs engage in a wide range of financial products, depending on the structure and industry focus. For example, some CDFIs concentrate on consumer products, offering bank accounts and originating mortgages. Others are predominantly real estate lenders, issuing products such as acquisition and predevelopment loans, construction loans, and types of mini-permanent/permanent financing. Small business-focused CDFIs rose to prominence during the COVID-19 pandemic, issuing small business loans and PPP loans to small-business owners. Pairing flexible capital with high-touch borrower support and technical assistance is a key part of the CDFI business model.
Although CDFI banks and credit unions are regulated by state and federal banking regulators, CDFI loan funds and venture capital funds are unregulated. CDFIs of all types are typically certified by the CDFI Fund at the U.S. Treasury Department.iv Certified CDFIs are eligible to apply for grants and low-cost debt capital through competitive application processes at the CDFI Fund; certification also provides eligibility for resources from other government agencies and some private funders (e.g., banks). The number of CDFIs not certified by Treasury is unknown; for the purpose of this analysis, we look at certified CDFIs.
Unlike banks and credit unions, which are primarily funded through deposits, or fintech lenders, who heavily rely on private capital markets, nondepository CDFIs are typically funded through a mix of public, private, and philanthropic sources of capital, creating unique balance sheets relative to other types of lenders. As seen in Figure 1, data from the Federal Reserve’s 2021 CDFI Survey indicate that nondepository CDFIs report debt capital from a wide variety of sources, including federal and local government, national and local philanthropy, and banks of all sizes. Government and philanthropic sources, in addition to individual donors and retained earnings, are also sources of equity for these CDFIs. CDFIs can offer flexible capital to borrowers not served by other financial institutions by creatively blending financing from this variety of sources.
Figure 1: Sources of Nondepository CDFI Debt Capital, 2021
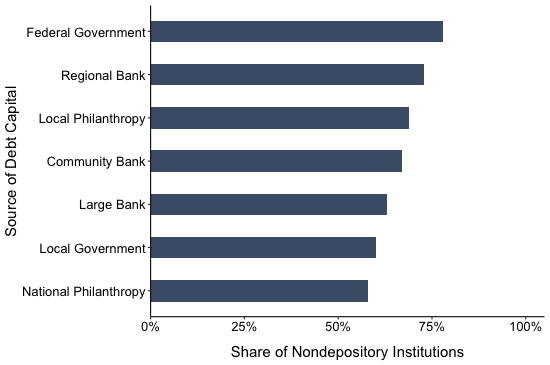
Source: Federal Reserve’s 2021 CDFI Survey.
According to the CDFI Fund’s Fiscal Year 2022 Agency Financial Reportv there were 1,380 certified CDFIs nationwide as of September 30, 2022: 42 percent were loan funds; 34 percent were credit unions; 23 percent were banks, thrifts, and holding companies; and just 1 percent were community development venture capital funds. At that time, certified CDFIs had total assets collectively estimated at almost $247 billion. CDFI credit unions held the biggest share of the CDFI market by assets (60 percent). See the CDFI Industry Overview Resources box for more industry information.
CDFI Industry Overview Resources
- Federal Reserve’s Consumer Compliance Outlook 2022 Article on CDFIs
- University of New Hampshire Carsey Center for Impact Finance publications on the CDFI industry
- Opportunity Finance Network’s 2023 CDFI 101 Toolkit
- Federal Reserve Bank of New York: Sizing the CDFI Market—Understanding Industry Growth
Why Is It Difficult to Create a Standard Financial “Report Card” for CDFIs?
Mission and community impact goals are key to the CDFI model and organizational strategy. A CDFI’s mission can shape its structure, nonprofit/for-profit status, sources of capital, industries and communities served, and types of financial products offered. These varied considerations can result in different financial pictures, all of which contribute to considerable heterogeneity across the industry.
CDFI loan funds are unique entities relative to others. Although nearly half of CDFIs are loan funds, they are not regulated by traditional banking regulatory agencies, making it difficult to compare them to depositories or for-profit institutions. They receive government and philanthropic support, further complicating balance sheets, but they operate heavily with debt capital; thus, commitments to CDFIs go beyond traditional philanthropic support of nonprofit organizations.
All these factors make them more difficult to understand from the perspective of those unfamiliar with the sector. Thus, CDFI loan funds make a particularly illustrative case study of the difficulties in creating uniform financial assessment standards for CDFIs, which we consider in more detail in the following sections.
Data Availability
Data on CDFIs are available from a variety of sources, each with its own advantages and disadvantages. To our knowledge, there is currently no comprehensive source of financial or impact evaluation data on the full set of certified CDFIs that is readily available to the general public.
The CDFI Fund within the U.S. Treasury Department collects financial data on certified CDFIs. They publicly release several reports and data sets.
- Reports:
- ACR Snapshot. The latest release represents data from fiscal year 2020. This report uses data from the CDFI Annual Certification and Data Collection Report (ACR) (which must be completed by all certified CDFIs).vi The information is available to the public at an aggregate, industry level.
- CDFI Program and NACA Program Financial Assistance Award Recipients. This report is a summary snapshot of CDFI Program and Native CDFI Assistance Program (NACA Program) Financial Assistance (FA) Award recipients’ performance. The latest release covers fiscal year 2021.vii The information is available to the public at an aggregate, industry level.
- Data sets:
- Transaction Level Report (TLR). This is anonymized transaction-level data for institutions that received FA Awards. The latest release covers fiscal year 2021.
- Consumer Loan Report (CLR). This is an anonymized consumer loan report, which provides information from CDFI banks and credit unions (not loan funds) that received Program Awards on their consumer loans in low-income communities. The latest release covers fiscal year 2021.
In years past, the CDFI Fund released a report called the Institution Level Report (ILR), which included anonymized, institution-level financial data. The latest release of this data covers fiscal year 2017. The CDFI Fund currently collects similar information as part of its ACR and may release a public data file with this information in the future. This could potentially expand the data available to prospective investors, grantmakers, researchers, etc.
CDFI banks and credit unions submit call reports to their regulatory agencies, providing insights into their financial statements on a quarterly basis. Because they do not take deposits, CDFI loan funds are not required to submit these types of reports. Only some CDFIs publicly post audited financial statements on their websites, and although IRS form 990s also provide institution-level data on nonprofit CDFI financials, there is no easy way to pull and aggregate this source.
The only other source of institution-level data on CDFI financial statements (of which we are aware) is Aeris, a CDFI-specific rating entity that independently assesses the self-reported quarterly financials and year-end audited financials—along with impact management performance—of CDFIs and other private impact loan funds. This proprietary data source voluntarily captures approximately 150 nondepository CDFI loan fundsviii managing more than $19 billion in loan capital. We made use of proprietary data for fiscal years 2017‒2021 from Aeris for 139 nonprofit loan funds.ix Approximately half of the CDFIs who report data to Aeris were rated by Aeris in 2021. For more information on the Aeris data and the way we used it, please see the appendix.
Lack of Standardized Definitions
In addition to incomplete or unavailable data, the absence of standardized auditing practices has challenged the industry for years.x Both of these issues make it difficult to undertake the type of financial analysis on which corporate and other traditional investors typically rely. This lack of standardization extends to the ways ratios commonly used to assess financial health are calculated and has been cited by others in the industry as a potential barrier to continued growth in CDFI capitalization.xi For example, the net charge-off ratio is a commonly cited ratio in the context of a CDFI’s portfolio performance and financial health that provides a perspective on the share of loans a CDFI has written off. However, it is calculated differently by different CDFIs; some include restructured loans, and others do not. Transparency about what is or is not included and a standardized approach to this measure would facilitate investor understanding of a key measure of portfolio health. It is also worth noting that CDFI loan funds often engage in off-balance-sheet lending activities and loan participation structures that add additional layers of complication to their financial statements.
Aeris collects quarterly financial information from the CDFIs in its portfolio and reviews the data against previous reporting as well as against audits at fiscal year-end, and spreads data into a standard Performance Maps format. Key financial ratios are derived from institutional-specific combinations of datapoints to ensure that the ratios are appropriate for their purpose, taking into account the varied business models and financial structures of CDFIs. This is not dissimilar to how financial analysts across a variety of industries assess and evaluate financial data to obtain insights, but it does require a detailed understanding of the sector and individual institutions.
Because many potential investors and grantmakers new to the CDFI sector are unlikely to have the expertise and industry knowledge to manually adjust data, we conducted our analysis using the Aeris-cleaned but not manually adjusted financial data, using standardized ratio definitions provided to us by Aeris. The goal of our analysis was to draw conclusions about industry trends using these key financial ratios (see the Financial Ratios – A Closer Look box) to facilitate easier comparison of CDFI performance industry-wide. We hoped such an analysis would be broadly applicable outside of the Aeris portfolio (e.g., to future publicly available CDFI financial data from the Treasury Department or for CDFIs not included in the Aeris portfolio). This approach did result in some outliers and differences, however, relative to the original Aeris Performance Maps in cases where Aeris had made manual adjustments.
Financial Ratios – A Closer Look
Based on a series of conversations with industry experts and practitioners, along with a review of literature on CDFI financials, we started with nine ratios commonly used to evaluate both banks and nonprofits. In the text, we highlight ratios with meaningful variation by primary lending line and institution size. Here are details on each of the four financial ratios referenced in the charts, along with Net Asset Ratios commonly used in the industry but not included in Figures 2-4 here because they were not statistically significantly different across lending line and institution size.
Deployment Ratio
What it measures: The share of total available capital that is being lent out by the CDFI.
Why it matters: Deployment of loan capital is a key part of a CDFI’s work. High deployment of capital enables a CDFI to serve borrowers, increase its earned income, and grow its loan portfolio.
Calculation:
Total On-Balance-Sheet Loan Portfolio / Total Lending CapitalSelf-Sufficiency Ratio
What it measures: The share of a CDFI’s costs that are covered by earned revenue (as opposed to grants and donated capital).
Why it matters: Serving harder-to-reach borrowers often requires some level of subsidy. A CDFI’s ability to cover its expenses with its earned revenue (without needing grant support) tells us about the organization’s approach to earned revenue and expense management.
Calculation:
Total Earned Revenue / Total ExpensesLoan Loss Reserve (LLR) Ratio
What it measures: The percentage of loan capital outstanding that is set aside to cover potential losses.
Why it matters: The LLR ratio can tell us about a CDFI’s level of credit risk and risk tolerance.
Calculation:
Loan Loss Reserves / Total Loans ReceivableNet Charge-Off Ratio
What it measures: The share of a CDFI’s loan portfolio that is unlikely to be paid back and has been written off, less any funds recovered.
Why it matters: This ratio provides information about historical losses and loan portfolio quality.
Calculation:
(Total Loans Charged Off – Recoveries) / Total Loans ReceivableUnrestricted Net Asset Ratio
What it measures: The share of a CDFI’s capital that comes from its net assets not restricted for specific programs or uses.
Why it matters: A CDFI’s unrestricted net assets indicate the size of its cushion to absorb any losses and protect debt investors.
Calculation:
Unrestricted Net Assets / Total AssetsNet Asset Ratio
What it measures: The share of a CDFI’s capital that comes from net assets, both unrestricted and restricted.
Why it matters: A CDFI’s unrestricted net assets indicate the size of its cushion to absorb any losses and protect debt investors; restricted net assets may provide additional protection but are targeted for specific capital uses or program expenses.
Calculation:
Net Assets / Total AssetsWhen we analyzed this dataset across these financial metrics over five years of data (fiscal years 2017‒2021), we found that it was still difficult to draw sector-level conclusions. There is a lot of variability in the ratios, little correlation across ratios (e.g., a high unrestricted net asset ratio did not predict a high deployment ratio), and significant movement from year to year, both within individual CDFIs and across sector means and medians. Some of this may have been driven by our choice to apply standardized ratios across the entire industry, but it is also a result of changing economic and market conditions (namely, the COVID-19 pandemic and related funding efforts), as well as differences across both CDFI business models and interpretations of the financial ratios themselves, which we discuss in further detail in the following sections.
Diversity of Business Models
CDFI business models are diverse; not only do they vary by primary lending activity, but they also can differ by institution size and organizational strategy (e.g., target client risk profile and sources and pricing of loan capital). This diversity is reflected in the annual “Side by Side” industry report produced by the Opportunity Finance Network (OFN)xii—a national network of more than 390 CDFIs. The 2021 fiscal year report assesses CDFI financial performance for a pool of 324 CDFIs (303 of which are loan funds) and, in doing so, divides the majority of those institutions into 35 different peer groups based on asset size and primary financing sector, among other factors. The high number of peer groups points to the difficulty of industry-wide analysis and even analysis within financing sector without further segregation by asset size.
In our analysis of loan funds based on Aeris data, we found that trends in the kinds of financial ratios typically used to assess financial health varied by lending sector and asset size. For instance, across a five-year average of CDFI financial data, there were consistent variations in financial ratios between CDFIs lending to small businesses and those focusing on real estate lending (which include CDFIs lending both for housing development and commercial real estate and community facilities, but not those doing home mortgage financing; Figure 2). The mean small-business lender has lower deployment and self-sufficiency ratios than the mean real estate lender. The mean small-business lender also has a higher loan loss reserve ratio and net charge-off ratio.
These variations in key financial ratios are not unexpected, given the differences between small-business and real estate lending. Typical small-business loans tend to be viewed as riskier than real estate loans due to the type of collateral underlying them, resulting in higher charge-off rates and a need to hold higher levels of loan loss reserves. Small-business loans also tend to be smaller and shorter-term in nature, meaning CDFIs that lend to small businesses must make more loans and recycle capital at a faster rate, which increases operating expenses and impacts self-sufficiency.
Figure 2: Average Financial Ratios by Primary Lending Line
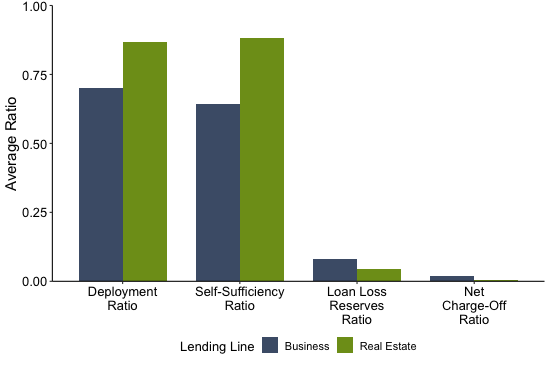
Note: Differences in ratios are statistically significant at the 5 percent level.
Source: Authors’ calculations of Aeris data, average of fiscal years 2017‒2021.However, lending sector and asset size are also correlated—small-business lenders tend to be smaller organizations, while the larger organizations are more likely to do real estate lending (Figure 3)—making it difficult to determine whether variations in the financial ratios were due to asset size or lending type.
Figure 3: Assets by Primary Lending Line, Fiscal Year 2021
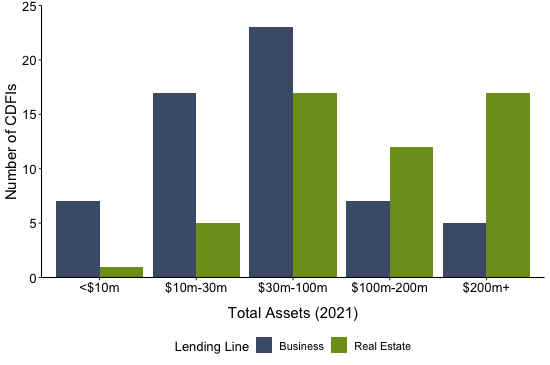
Distribution of CDFIs is statistically significantly different by primary lending line at the 1 percent level.
Source: Author’s calculations of Aeris data, fiscal year 2021.Differing Interpretation of Key Metrics, Depending on Mission and Model
Further complicating industry-level analysis, there is not always a standard interpretation of financial ratios, even when the data inputs and calculations are standardized. The self-sufficiency ratio illustrates this challenge, as it can vary greatly based on several factors related to risk of population served and organizational strategy. For example, the hardest-to-reach clients often require the most technical assistance, which increases the cost to a CDFI. As a result, CDFIs that focus on particularly marginalized clients may be more dependent on external subsidy to meet their mission. A lower self-sufficiency ratio in this example does not necessarily reflect an organization that is riskier or inefficient, but rather a strategic decision by the CDFI to serve the most marginalized clients. However, an alternative interpretation of this approach is that a strategic model necessitating deeper levels of subsidy and generating less income requires the CDFI to engage in more regular capital-raising efforts to maintain this level of subsidy, which could be challenging to sustain.
In our analysis of Aeris data, we found that real estate lenders and the largest lenders tended to have higher self-sufficiency ratios than business/micro lenders or the smallest lenders (Figure 4). CDFIs that focus primarily on small-business lending tend to be smaller, as measured by size of loan portfolio and total assets. This is consistent with findings from other industry studies showing that higher rates of self-sufficiency are typically seen in CDFIs with higher asset bases, which typically have lower levels of operating expense per dollar of assets managed.xiii
Figure 4: Self-Sufficiency Ratio by Primary Lending Line and Asset Size
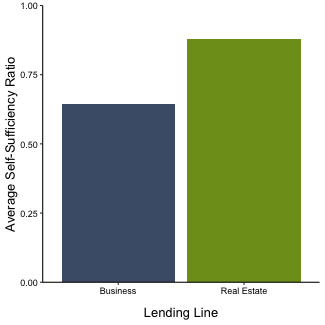
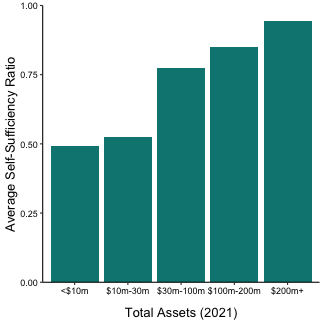
Self-sufficiency ratio is statistically significantly different by lending line at the 1 percent level. The distribution of self-sufficiency ratio by total assets is statistically significantly different at the 1 percent level.
Source: Author’s calculations of Aeris data, average of fiscal years 2017‒2021.Another example of differing ratio interpretations is the loan loss reserve (LLR) ratio, which could be high because a CDFI is expecting higher delinquencies due to an external market impact or because the CDFI is intentionally serving clients at higher risk for delinquency and has bolstered its LLR with philanthropic capital to offset this risk. A high LLR ratio could be interpreted as a red flag or could simply point to a strategy of targeting the hardest-to-serve.
Financial ratios can also be impacted by strategic decisions, such as whether to sell loans to third parties. Selling sizable batches of portfolio loans can result in financial ratios that differ from those of a CDFI holding all its loans on its balance sheet. Outside of consumer mortgages, there is not a robust market for CDFI loans; however, there are some newer platforms that seek to provide secondary-market liquidity for CDFI small-business lenders. A recent report by Simmons and Klein notes that some traditional ratios used by philanthropic and public sector funders can be misleading for CDFIs that participate in these novel liquidity programs and that alternative or supplemental measures may be needed to fully understand these CDFIs’ financial positions.xiv For example, under the model being used by Scale Link, a non-profit that facilitates the sale of CDFI small business loans to banks who buy them for CRA value, selling loans can impact ratios related to portfolio quality because loans that are sold are typically current, resulting in a higher delinquency rate. But these changed portfolio ratios do not reflect that the total number of dollars at risk have declined. xv Loan sales under this model may also temporarily affect the deployment ratio.xvi Although the ability to access additional liquidity by selling loans can strategically benefit a CDFI, absent this context on the CDFI’s strategy, the resulting financial ratios can raise flags.
These varying ratio interpretations can also be related to the inherent tensions within the CDFI business model. CDFIs are, at once, trying to serve borrowers who are often more challenging to underwrite and perceived as riskier than those served by traditional financial institutions, while also trying to provide these borrowers with the lowest-cost capital and trying to generate enough return and investment to sustain continued lending and technical assistance. Whether a CDFI chooses to deeply subsidize interest rates or whether it chooses to reach a greater number of borrowers with the same amount of public or philanthropic support, for example, are ultimately strategic decisions of the CDFI. But these differing strategic decisions can produce different financial metrics for the CDFI, despite both types being equally financially healthy.
As a result of these nonstandardized business models, a given financial ratio cannot always be easily compared across organizations (as also noted by Swack et al., 2012). There is no one-size-fits-all approach to analyzing a CDFI’s financial performance, and no one metric alone will capture the health of any one CDFI; part of the challenge is the need to look at these institutions holistically. What makes CDFIs so well positioned to fill the gaps and serve the hardest-to-reach (flexibility and varied sources of capital) is also what makes industry-wide analysis and standardization of financial metrics so challenging.
No Easy Reference Points
Another barrier to standardized analysis is the lack of appropriate reference points for CDFI loan funds, both within the sector and in the broader financial system. Given the heterogeneity within the sector, there is no industry-specific set of benchmarks. With respect to ratio analysis, not all ratios serve a financial analysis purpose. Some ratios can be an indicator of an organization’s strategy, in addition to an indicator of financial risk; some describe asset/portfolio quality, while others describe operational decisions. Tradeoffs can occur when one ratio is prioritized over another or a specific ratio outcome is sought by management for a strategic reason. The importance of understanding a CDFI’s strategy or business model as context for ratio interpretation makes it difficult to set industry standards. As noted previously, in our analysis of the Aeris data we did not find correlations across the different financial ratios.
It is also difficult to identify benchmarks outside of the CDFI sector that are comparable and relevant. CDFIs’ unique financial structure, varied sources of capital, and focus on serving hard-to-reach borrowers (i.e., those with more challenging credit profiles) makes it difficult to compare CDFI loan fund financials to those of traditional banks or credit unions. Some industry studies have pointed to sector-specific benchmarks, such as comparing financial and loan performance data for CDFIs focused on home lending to data from the Mortgage Bankers Association (MBA), and data from CDFI small-business lenders to Small Business Administration (SBA) data.xvii Although this approach is helpful in understanding the performance of a subset of loan funds with some context, it is certainly not an apples-to-apples comparison and is not an approach widely adopted by industry professionals.
What Could Help Potential Investors Better Understand and Navigate This Industry?
Based on data analysis, a review of the literature, and interviews with industry experts, there are several considerations for ways the sector could make understanding CDFIs more accessible to nontraditional CDFI funders, as well as considerations for new investors and grantmakers to keep in mind as they explore potential investments. These recommendations reflect the inherent tension between tailoring and accessibility that we saw throughout this analysis. In many ways, CDFIs are unique entities—different from other institutions in the financial system and from each other. This uniqueness has positioned them to be able to be flexible and nimble in serving their communities but poses challenges with respect to understanding the sector, being a conduit for rapid capital deployment in times of crisis (part of CDFIs’ “first-responder” role), and scaling CDFI models and solutions.
In the end, a “both/and” approach may be the most effective. The analysis presented in this brief suggests the importance of the following.
-
Context-specific understanding: Heterogeneity in the sector (and even within business lines) creates challenges for large-scale institutional investors to make decisions about investment the way they are used to The CDFI industry (and CDFI loan funds in particular) can be difficult to understand unless one is in it. Investors or donors could consider assessing each CDFI in the context of its unique characteristics and seek closely defined peer institutions, creating a holistic understanding of each CDFI loan fund. Metrics can help inform the picture, but interpreting them may require more understanding of the organization’s strategy and context.
The analysis Aeris provides for the CDFIs in its portfolio enables this context-specific assessment. The process that Aeris undergoes to derive key financial ratios for CDFIs is not dissimilar to how traditional Wall Street investors spread and analyze the financial statements of corporations by reclassifying different elements of the financial statements to gain insights.
However, to do this type of analysis for CDFIs requires a level of industry understanding and expertise that a new investor (or philanthropist) may not have. As exists with other industries, the CDFI sector may be well served by growing the number of financial analysts who specialize in CDFIs, in addition to creating opportunities for CDFI-specific financial analysis training for traditional financial analysts.
-
Better data collection and reporting: Standardization of financials is necessary to attract investors who are new to the space and looking to make more impact-focused investments without deep research into CDFIs. Both consistency in how ratios are calculated and what goes into different line items are needed to be able to make comparisons. As described in this brief, certain aspects of the CDFI loan fund model (e.g., varied capital stacks, flexibility to adapt business models to market needs) make standardization challenging. However, based on our analysis, it appears a certain level of standardization is both possible and could benefit the industry. Although CDFIs may need contextualized approaches to a certain extent, the lack of standard definitions and metrics complicates the ability of external entities to compare performance across institutions. In the absence of more specialized financial analysis capacity, increased standardization of CDFI financials could make investors unfamiliar with CDFIs more willing to pursue investment opportunities.
It is worth noting that the financial standardization challenge is not new to the industry. It is also important to acknowledge the efforts that industry leaders have undertaken, as well as the progress they have made. OFN has sought to drive CDFIs toward greater standardization of financials through its Performance Counts initiativexviii from 2014, as has Aeris, which we describe in this brief. To date, 13 CDFIs have achieved issuer credit ratings by S&P Global Ratings, which indicates a level of financial standardization in line with traditional financial institutions.
-
Reasonable parameters for comparison: Lack of a clear rule of thumb about to whom CDFIs should be compared is a challenge for those trying to understand CDFI financials. Prospective investors would benefit from being able to look to some internal and external points of comparison for at least some subsectors of the CDFI loan industry. As described above, there is some history of comparing mortgage loans to MBA data or CDFI small-business lenders to SBA data. Although these comparisons pose challenges, they provide helpful context, particularly for those new to the sector. If the CDFI sector were able to identify and agree on external sectors most closely aligned with particular lines of CDFI lending, this type of industry standard guideline for external comparison could benefit both prospective investors and the CDFI sector itself.
Similarly, it would be helpful if the industry found ways to facilitate broader within-sector comparisons. Creating groupings that would allow investors or grantmakers to compare larger numbers of CDFIs at once could make these analyses more accessible or allow investors to consider a wider array of CDFIs (and CDFI activities and target markets). Particularly for investors looking to make impact-driven investments but without a targeted mission, starting with a wider field could be a more appropriate approach. Another possibility would be identifying any common financial thresholds, which could help demarcate more financially sound CDFIs and would facilitate within-sector comparisons. Another would be establishing broader peer groups for comparison (for example, collapsing OFN’s 35 peer groups in the side-by-side analysis, as it does toward the end of its report, where it reports metrics by 18 broader peer groups).
Conclusion
CDFIs are unique financial institutions, and their financial and operational models vary widely. That which enables them to effectively respond to different needs in different communities is also what makes them difficult to analyze using the tools and approaches of traditional financial analysis. Although certain structural challenges and inherent tensions are fundamental to CDFIs by their nature, efforts around standardization in the areas described above hold promise for making the industry more accessible to those new to CDFIs. The sector has proven itself to be a critical part of this country’s financial ecosystem, and sustained access to capital sources outside those that have historically funded the work of CDFIs would expand the sector’s ability to extend its impact. The sector itself can take steps to make its financial data more accessible to mainstream financial actors; however, it is important for anyone seeking to assess the financial health of an individual CDFI or the sector as a whole to understand the unique context in which these financial intermediaries operate.
Appendix: About Aeris Data
Aeris collects quarterly financial information from the CDFIs in its portfolio and reviews the data against previous reporting as well as against audits at fiscal year-end, and spreads data into a standard Performance Maps format. Key financial ratios are derived from institutional-specific combinations of datapoints to ensure that the ratios are appropriate for their purpose, taking into account the varied business models and financial structures of CDFIs. We obtained a custom product from Aeris that contained the raw inputs used to generate the Performance Map spreadsheets for each CDFI each year from 2017 to 2021. We eliminated four for-profit CDFIs from our analysis because their for-profit structure makes them financially different from nonprofit CDFIs. The data we used came from audited, annual financial statements for 2017‒2020. Much of the financial data for 2021 came from audited financials, but some subset of the CDFIs had not yet submitted their audited FY2021 data at the time of the data download.
We created the financial ratios used in this analysis from the raw inputs we received from Aeris, using Aeris-provided standardized ratio definitions. Because Aeris manually adjusts some of the ratios for individual CDFIs, these standardized definitions will not perfectly match the data in the Performance Maps. We originally began with a set of nine financial ratios based on the literature and our discussions with CDFI professionals; we present data on a subset of these ratios in the text, focusing on ratios that were significantly different either by lending line or institution size.
We assigned CDFI lending sector based on Aeris-provided “peer groups.” Aeris divides CDFIs into four groups: business/micro, community facilities and commercial real estate, housing development, and other. “Other” CDFI types can include intermediaries, home finance, other consumer-focused CDFIs, and other institution types that do not have sufficient peers in the Aeris data. For our purposes, we combined community facilities and commercial real estate with housing development CDFIs to look at all real estate CDFIs together. We present only comparisons of business/micro and real estate lenders because of the diversity of institutions in the “other” category and the small share of institutions in this group.
With any dataset, there is the possibility of outliers; some may be organizations whose data are just outside the norm, and others may be driven by reporting error. In examining the Aeris data, our original plan was to remove outliers to look at trends in the sector, as some very large or small outliers were shifting the means and medians. However, when we examined the outliers, we found that many were accurately calculated and not (as can be the case with outliers) the result of a reporting or calculation error. Instead, the outlier reflected something about that unique CDFI or the way it reports different line items that make up our standardized ratio definitions. As a result, in data examples provided in the text, we have kept all the data, including those we had flagged as possible outliers. Although it is accurate to include these data, it is important to understand that ratios on the extreme ends of the spectrum (e.g., a current ratio of 366, as reported by one CDFI) can skew the medians and especially the means when engaging in industry-wide analysis. This again highlights the challenges of working with these nonstandardized data, as well as the challenges that result when trying to compare widely varying financial models of CDFIs.
The views expressed in this report are those of the authors and do not necessarily reflect the views of the Federal Reserve Bank of San Francisco or the Federal Reserve System.
Acknowledgements
We would like to thank the industry experts who spoke with us in the early stages of this research and the staff at Aeris, in particular Jon Schwartz, for the many discussions about the Aeris data and for working to integrate additional data into our download. We also would like to thank Alexander Ramiller for his excellent research assistance. We thank our Federal Reserve colleagues Charlene van Dijk, Michael Eggleston, and Ian Galloway for sharing their deep knowledge of the CDFI industry and providing guidance on this work. Finally, we thank Elizabeth Kneebone, Crystal Ejanda, and others at the SF Fed for helpful comments and editorial guidance.
End Notes
i. “Agency Financial Report: Fiscal Year 2022, “Community Development Financial Institutions Fund, U.S. Department of the Treasury. Agency Financial Report Fiscal Year 2022 (cdfifund.gov).
ii. Anna Alvarez Boyd and Charlene van Dijk, “An Overview of Community Development Financial Institutions,” Consumer Compliance Outlook, First Issue 2022 (consumercomplianceoutlook.org); Michael Swack, Jack Northrup, and Eric Hangen, “CDFI Industry Analysis: Summary Report.” 2012.
iii. At the start of this project, we spoke with twelve experts at CDFIs, CDFI industry organizations, and nonprofit institutions to understand key CDFI financial metrics.
iv. On December 7, 2023, the CDFI Fund released a revised CDFI certification application.
v. “Agency Financial Report.”
vi. “CDFI Annual Certification and Data Collection Report (ACR): A Snapshot for Fiscal Year 2020,” Community Development Financial Institutions Fund, U.S. Department of the Treasury. 2020 ACR Report (cdfifund.gov).
vii. “CDFI Program and NACA Program Financial Assistance Award Recipients: A Snapshot of FY 2021 Reported Activities,” Community Development Financial Institutions Fund, U.S. Department of the Treasury. CDFI, CCME Joint Presentation at LA MDI Conference (cdfifund.gov).
viii. Aeris does have information on a small handful of CDFI entities with structures other than loan fund.
ix. Much of the financial data for 2021 come from audited financials, but some subset of the CDFIs had not yet submitted their audited FY2021 data at the time of the data download.
x. Boyd and van Dijk, “An Overview of Community Development Financial Institutions”; Swack, Northrup, and Hangen, ”CDFI Industry Analysis.”
xi. Swack, Northrup, and Hangen, “CDFI Industry Analysis.”
xii. “Opportunity Finance Institutions Side by Side: Fiscal Year 2021 OFN Member Data Analysis,” 24th Edition. CDFI Resource Library (ofn.org).
xiii. Swack, Northrup, and Hangen, “CDFI Industry Analysis.”
xiv. Brett Simmons and Joyce Klein, “We Have New Tools To Capitalize CDFI Growth – Let’s Use Them,” 2023, We-Have-New-Tools-To-Capitalize-CDFI-Growth-—-Lets-Use-Them.pdf (aspeninstitute.org).
xv. Ibid.
xvi. Ibid.
xvii. Swack, Northrup, and Hangen, “CDFI Industry Analysis.”
xviii. “Performance Counts,” Opportunity Finance Network, accessed September 25, 2023, Performance Counts Initiative (ofn.org).
Article Citation
Sanchez-Moyano, Rocio and Sarah Simms. 2023. “Understanding CDFI Financial Data: A Primer for New Investors.” Federal Reserve Bank of San Francisco Community Development Research Brief 2023-05. doi: 10.24148/cdrb2023-05.